Hi Sander,
I’m trying to create a time-series for only weekends in May 2020 for OMI SO2 (https://disc.gsfc.nasa.gov/datasets/OMSO2e_003/summary?keywords=OMI%20so2). I’m aware that NASA’s Giovanni tool would enable me to create a monthly average time-series of OMI SO2, however, the time-series has to be continuous and creating a monthly average of only weekends or weekdays doesn’t seem possible. I was hoping that there is some way to do this in Harp/Visan and I was hoping you could help me out with this. I asked a similar question regarding MODIS AOD.
Best,
James
Hi James, filtering on weekday is currently not possible. I have created a HARP issue to have this added. We should probably be able to have this available in the next release.
Hi Sander,
Thank you for this and I am excited for the update. However, couldn’t I just download all the daily average files of L3 OMI SO2 data for weekends for a specific month and put them in a folder. Then, is there a code that I can run to avergage all the files? Maybe something like: average = harp.import_product("/Users/jpoetzscher/Downloads/OMI_Weekend_SO2/*.nc", post_operations=“bin();squash(time, (latitude,longitude))”)
Let me know!
Thanks,
James
For sure. Just manually putting the daily grids into a subdirectory and then merging them using the given post operations would also work.
The issue is Visan doesn’t support this L3 SO2 OMI product (https://disc.gsfc.nasa.gov/datasets/OMSO2e_003/summary?keywords=OMIso2).
Is there a way to use this data?
Otherwise I have to use the L2 daily granules and first create a daily average myself before gridding the daily averages. Currently to process the daily granules into a daily average I’ve been running:
product = harp.import_product(r"/Users/jpoetzscher/Downloads/May2020_SO2/May2/*.he5", operations=‘keep(latitude_bounds,longitude_bounds,SO2_column_number_density);bin_spatial(1801,-90,0.1,3601,-180,0.1);derive(SO2_column_number_density [DU]);exclude(SO2_column_number_density_weight)’, post_operations=“bin();squash(time, (latitude_bounds,longitude_bounds));derive(latitude {latitude});derive(longitude {longitude});exclude(latitude_bounds,longitude_bounds,latitude_bounds_weight,longitude_bounds_weight,count,weight)”)
Let me know if there’s a way to use the OMI SO2 L3 product and if not let me know if the code I’m using to merge the L2 granules into a daily average looks right.
Best,
James
I’m pretty sure I need to filter for more parameters but not sure which and how. That’s why using the pre-processed SO2 L3 data would be so helpful.
I missed that you were trying to use OMI L3. Those products are not actual L3 products. They are more like L2.5 products. They still contain alle the L2 pixels, but grouped together to “more easily” get all pixels for a specific subregion.
This might we be a useful product for a subsetting service, but for most users this product is probably of no use, and you are better of using the L2 product directly. This is also why we never added support for the OMI L3 products in harp.
To get actual L3 products for OMI you have to start with the L2 products just like is done for S5P.
Got it.
Given my current OMI SO2 code, do you have any suggestions on filtering solar azimuth, cloud cover etc. If you have code you’ve used before that would be great. Otherwise I can probably find the data providers recommendations but it will be more difficult.
Current code:
product = harp.import_product(r"/Users/jpoetzscher/Downloads/May2020_SO2/May2/*.he5", operations=‘keep(latitude_bounds,longitude_bounds,SO2_column_number_density);bin_spatial(1801,-90,0.1,3601,-180,0.1);derive(SO2_column_number_density [DU]);exclude(SO2_column_number_density_weight)’, post_operations=“bin();squash(time, (latitude_bounds,longitude_bounds));derive(latitude {latitude});derive(longitude {longitude});exclude(latitude_bounds,longitude_bounds,latitude_bounds_weight,longitude_bounds_weight,count,weight)”)
Forget my previous post. The data that you point to is an actual L3 product.
It has been a while since I looked at OMI, so things might have changed or my memory is playing tricks on me. I think I was confused with the 2G products (L3 products don’t exist that long).
These actually look like good products to support in HARP.
I will add a ticket to get these supported.
Ok sounds good when do you think that functionality will be added?
That might be a while, so for the short term you could either use the L2 products.
Or, and that might be easier, is to create your own HARP importer.
This is similar to my reply on the MODIS topic. You would use the HDF5 library or CODA to read the data in Python as numpy arrays. This is really easy:
import coda
import harp

pf = coda.open('/Users/sander/Downloads/OMI-Aura_L3-OMSO2e_2020m0610_v003-2020m0612t031446.he5')
try:
    latitude = coda.fetch(pf, '/HDFEOS/GRIDS/OMI_Total_Column_Amount_SO2/Data_Fields/Latitude')
    latitude = latitude[:,0]
    longitude = coda.fetch(pf, '/HDFEOS/GRIDS/OMI_Total_Column_Amount_SO2/Data_Fields/Longitude')
    longitude = longitude[0,:]
    so2 = coda.fetch(pf, '/HDFEOS/GRIDS/OMI_Total_Column_Amount_SO2/Data_Fields/ColumnAmountSO2_PBL')
finally:
    coda.close(pf)

product = harp.Product()
product.latitude = harp.Variable(latitude, ["latitude"])
product.latitude.unit = "degree_north"
product.longitude = harp.Variable(longitude, ["longitude"])
product.longitude.unit = "degree_east"
product.so2_column_number_density = harp.Variable(so2, ["latitude", "longitude"])
product.so2_column_number_density.unit = "DU"
harp.export_product(product, "omi-so2-20200610.nc")
ok thanks, I’ll try this out. Would I have to run this on every L3 file?
Yes. You would have to do this for each L3 file.
But you can use for loops in python to run over all products.
And instead of exporting each product to a file first, you could pass a list of convert harp.Product() instances to harp.execute_operations to perform the binning over multiple days and then only export the time averaged grid.
So if I’m exporting the time averaged grid from python aren’t I just completely not using VISAN?
You would only need VISAN if in the end you want to create a plot in VISAN of the result.
Sounds good. I really appreciate the help!
Hi Sander,
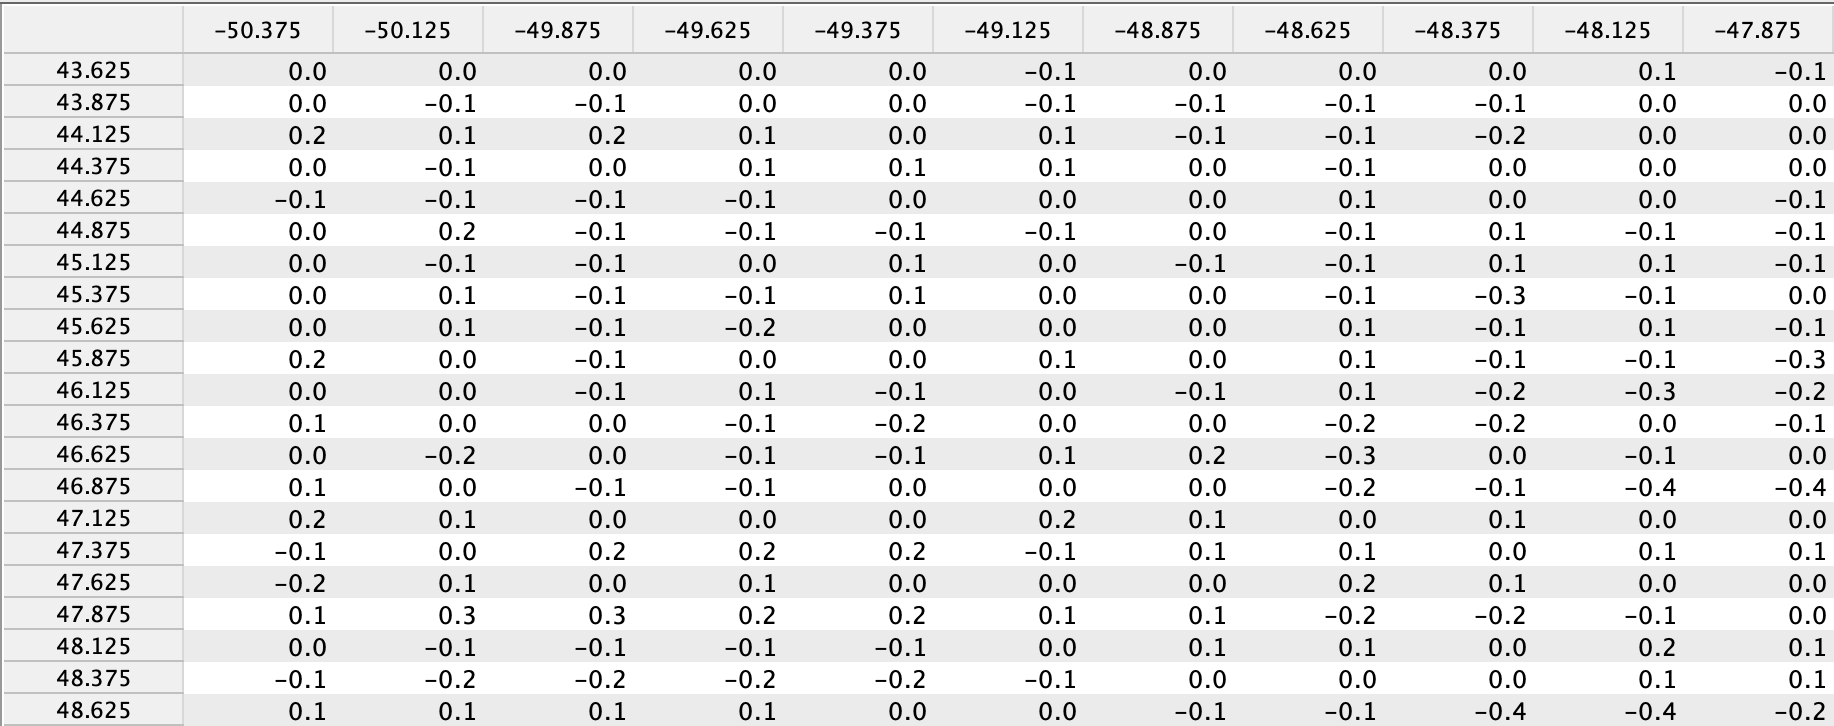
Thanks to your help and starter code I now have the for loop/average all done in python. I’m wondering if there’s a way to export as a csv/excel with long being vertical axis and lat as horizontal axis (like shown in image)
Here’s my code by the way:
import coda
import harp
import numpy
from os import listdir
#Local variables
productlist = []
Folder = r’/Users/varsharao/Downloads/SO2/May2020/’
OutFolder = r’/Users/varsharao/Downloads/SO2/MonthAverage/’
#Function for listing files
def list_files1(directory, extension):
return (f for f in listdir(directory) if f.endswith(’.’ + extension))
#Adding files to a list
FileList = list_files1(Folder, “he5”)
for File in FileList:
InFile = Folder + File
pf = coda.open(InFile)
try:
latitude = coda.fetch(pf, ‘/HDFEOS/GRIDS/OMI_Total_Column_Amount_SO2/Data_Fields/Latitude’)
latitude = latitude[:,0]
longitude = coda.fetch(pf, ‘/HDFEOS/GRIDS/OMI_Total_Column_Amount_SO2/Data_Fields/Longitude’)
longitude = longitude[0,:]
so2 = coda.fetch(pf, ‘/HDFEOS/GRIDS/OMI_Total_Column_Amount_SO2/Data_Fields/ColumnAmountSO2_PBL’)
finally:
coda.close(pf)
product = harp.Product()
product.latitude = harp.Variable(latitude, [“latitude”])
product.latitude.unit = “degree_north”
product.longitude = harp.Variable(longitude, [“longitude”])
product.longitude.unit = “degree_east”
product.so2_column_number_density = harp.Variable(so2, [“latitude”, “longitude”])
product.so2_column_number_density.unit = “DU”
productlist.append(product)
average = harp.execute_operations(productlist, post_operations=“bin();squash(time, (latitude,longitude))”)
OutFile = OutFolder + File[19:23] + File [24:26] + “.nc”
harp.export_product(average, OutFile)
I am not sure why you would want to export to csv/excel. You should be able to perform most analysis in python itself.
In any case, if you want to, Python has a built-in csv library and for excel there are several options, such as openpyxl.
Dear James,
After working with satellite data using IDL for 20+ years, I am trying to switch to python. I cannot thank you enough for sharing your code and ideas in this forum, it is truly helpful.
Good luck with everything,
MariLiza
1 Like