Hello everyone. 
I am analyzing Sentinel-5P images for the area of Serbia and I noticed something that is unusual in the image made on 29.11.2019:
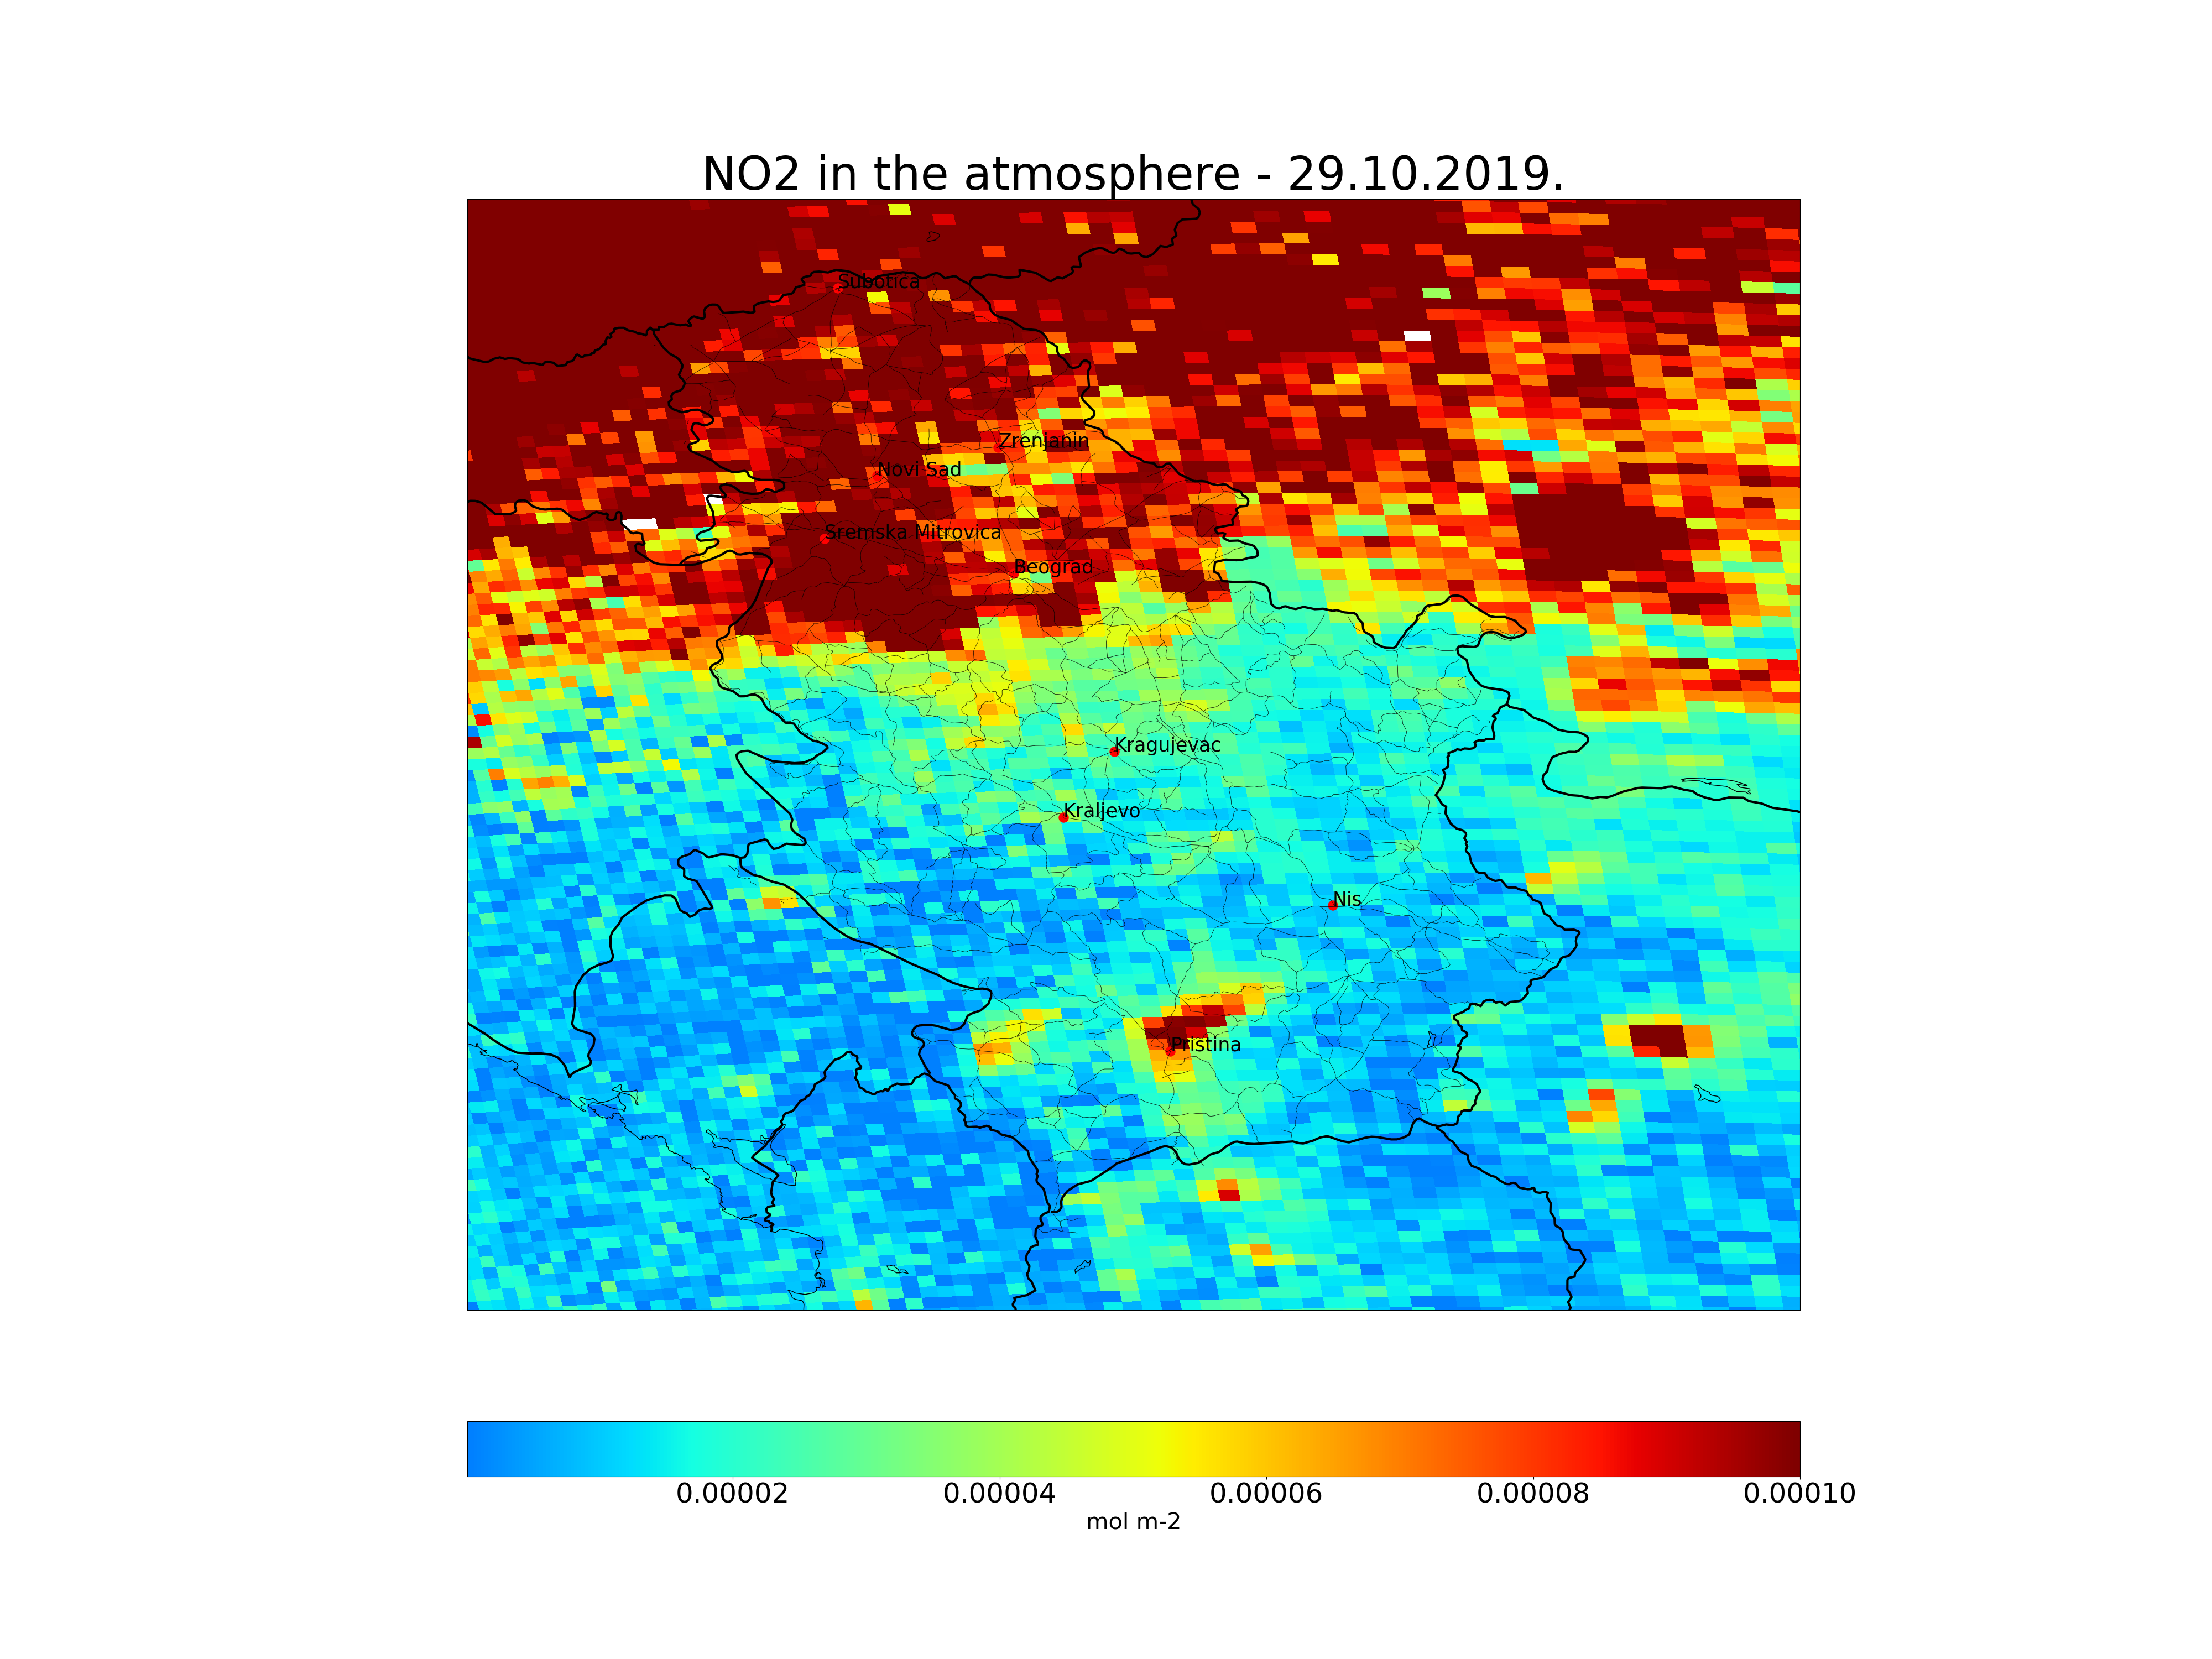
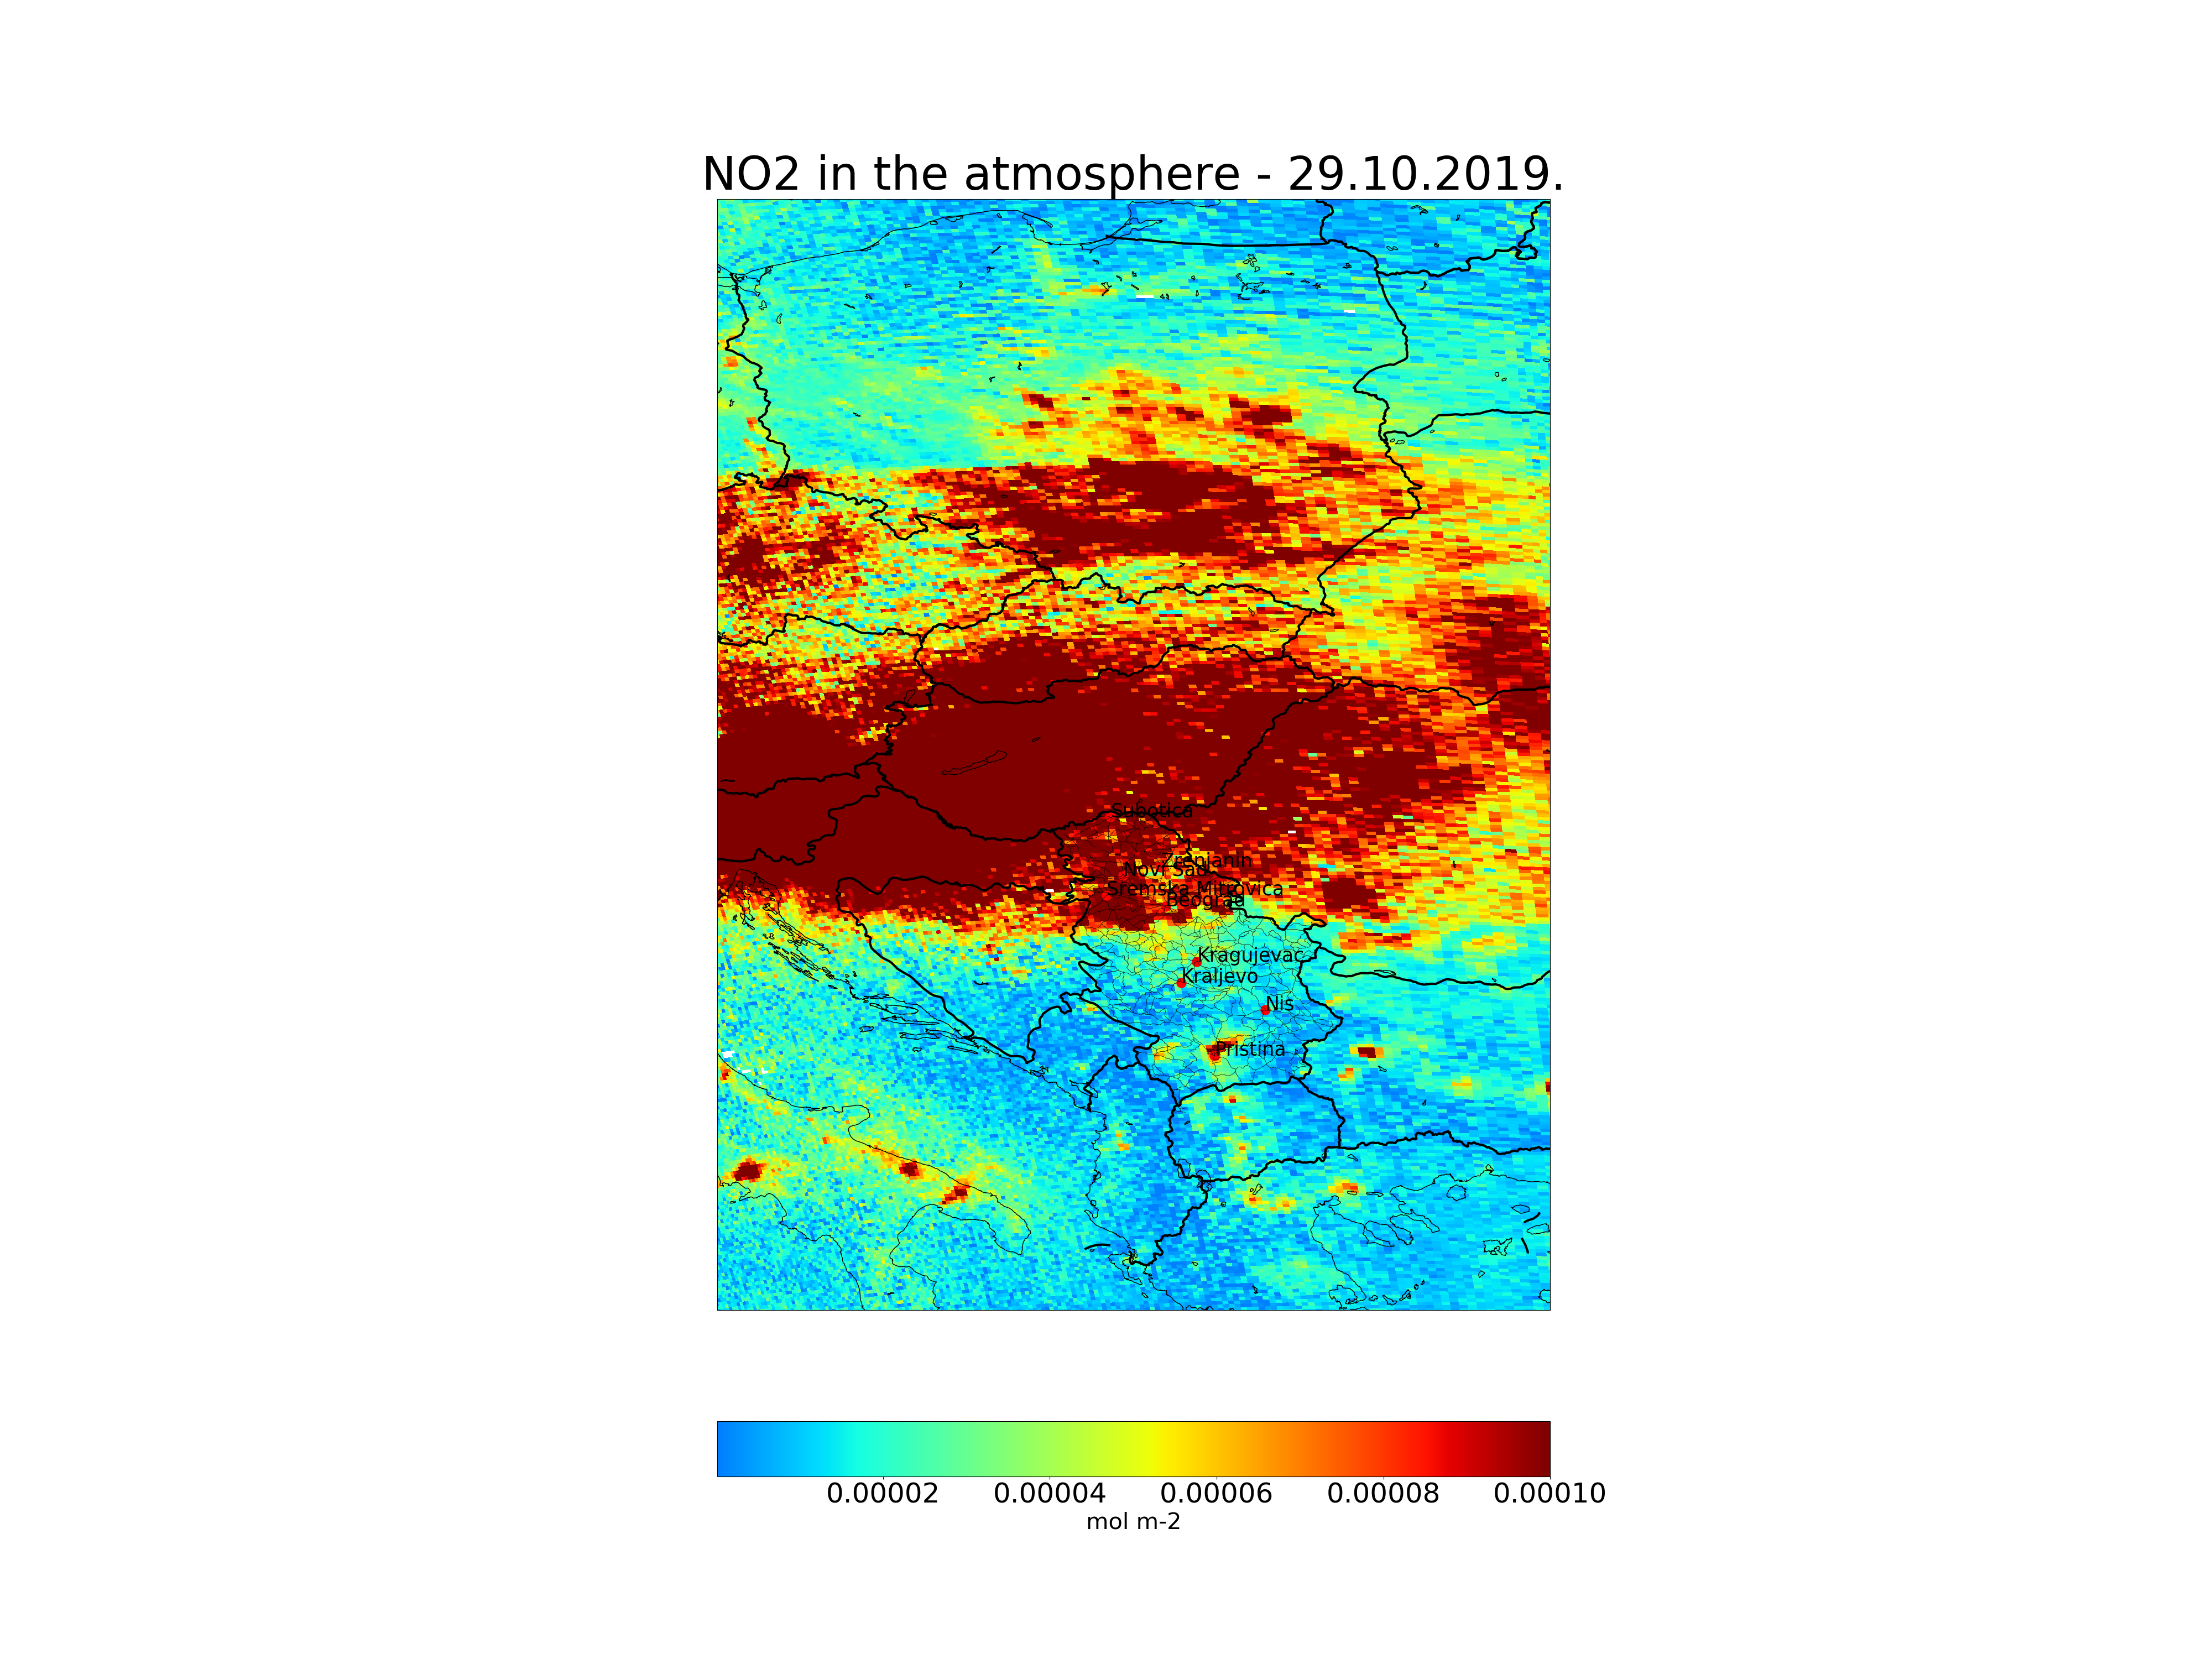
I can’t explain “pollution cloud” (in Serbia) because:
-there was a wind
-no mist
-high visibility
-news back then didn’t report anything
-the rest of the days near that date weren’t polluted like that
I didn’t do any preprocessing. I just loaded nc file (L2 product) with the python and ploted “nitrogendioxide_tropospheric_column” on the BaseMap. Moreover, the part of this image (middle Europe) for some reason couldn’t be loaded in the EO browser (and I tried on two computers and several browsers). I did some statistics regarding the pixels (just the pixels inside Serbia), just to make sure that I didn’t have some unregular values and everything was ok (at least I think that):
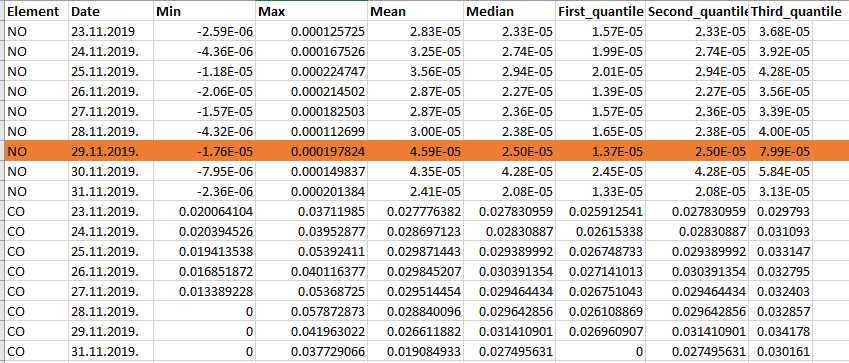
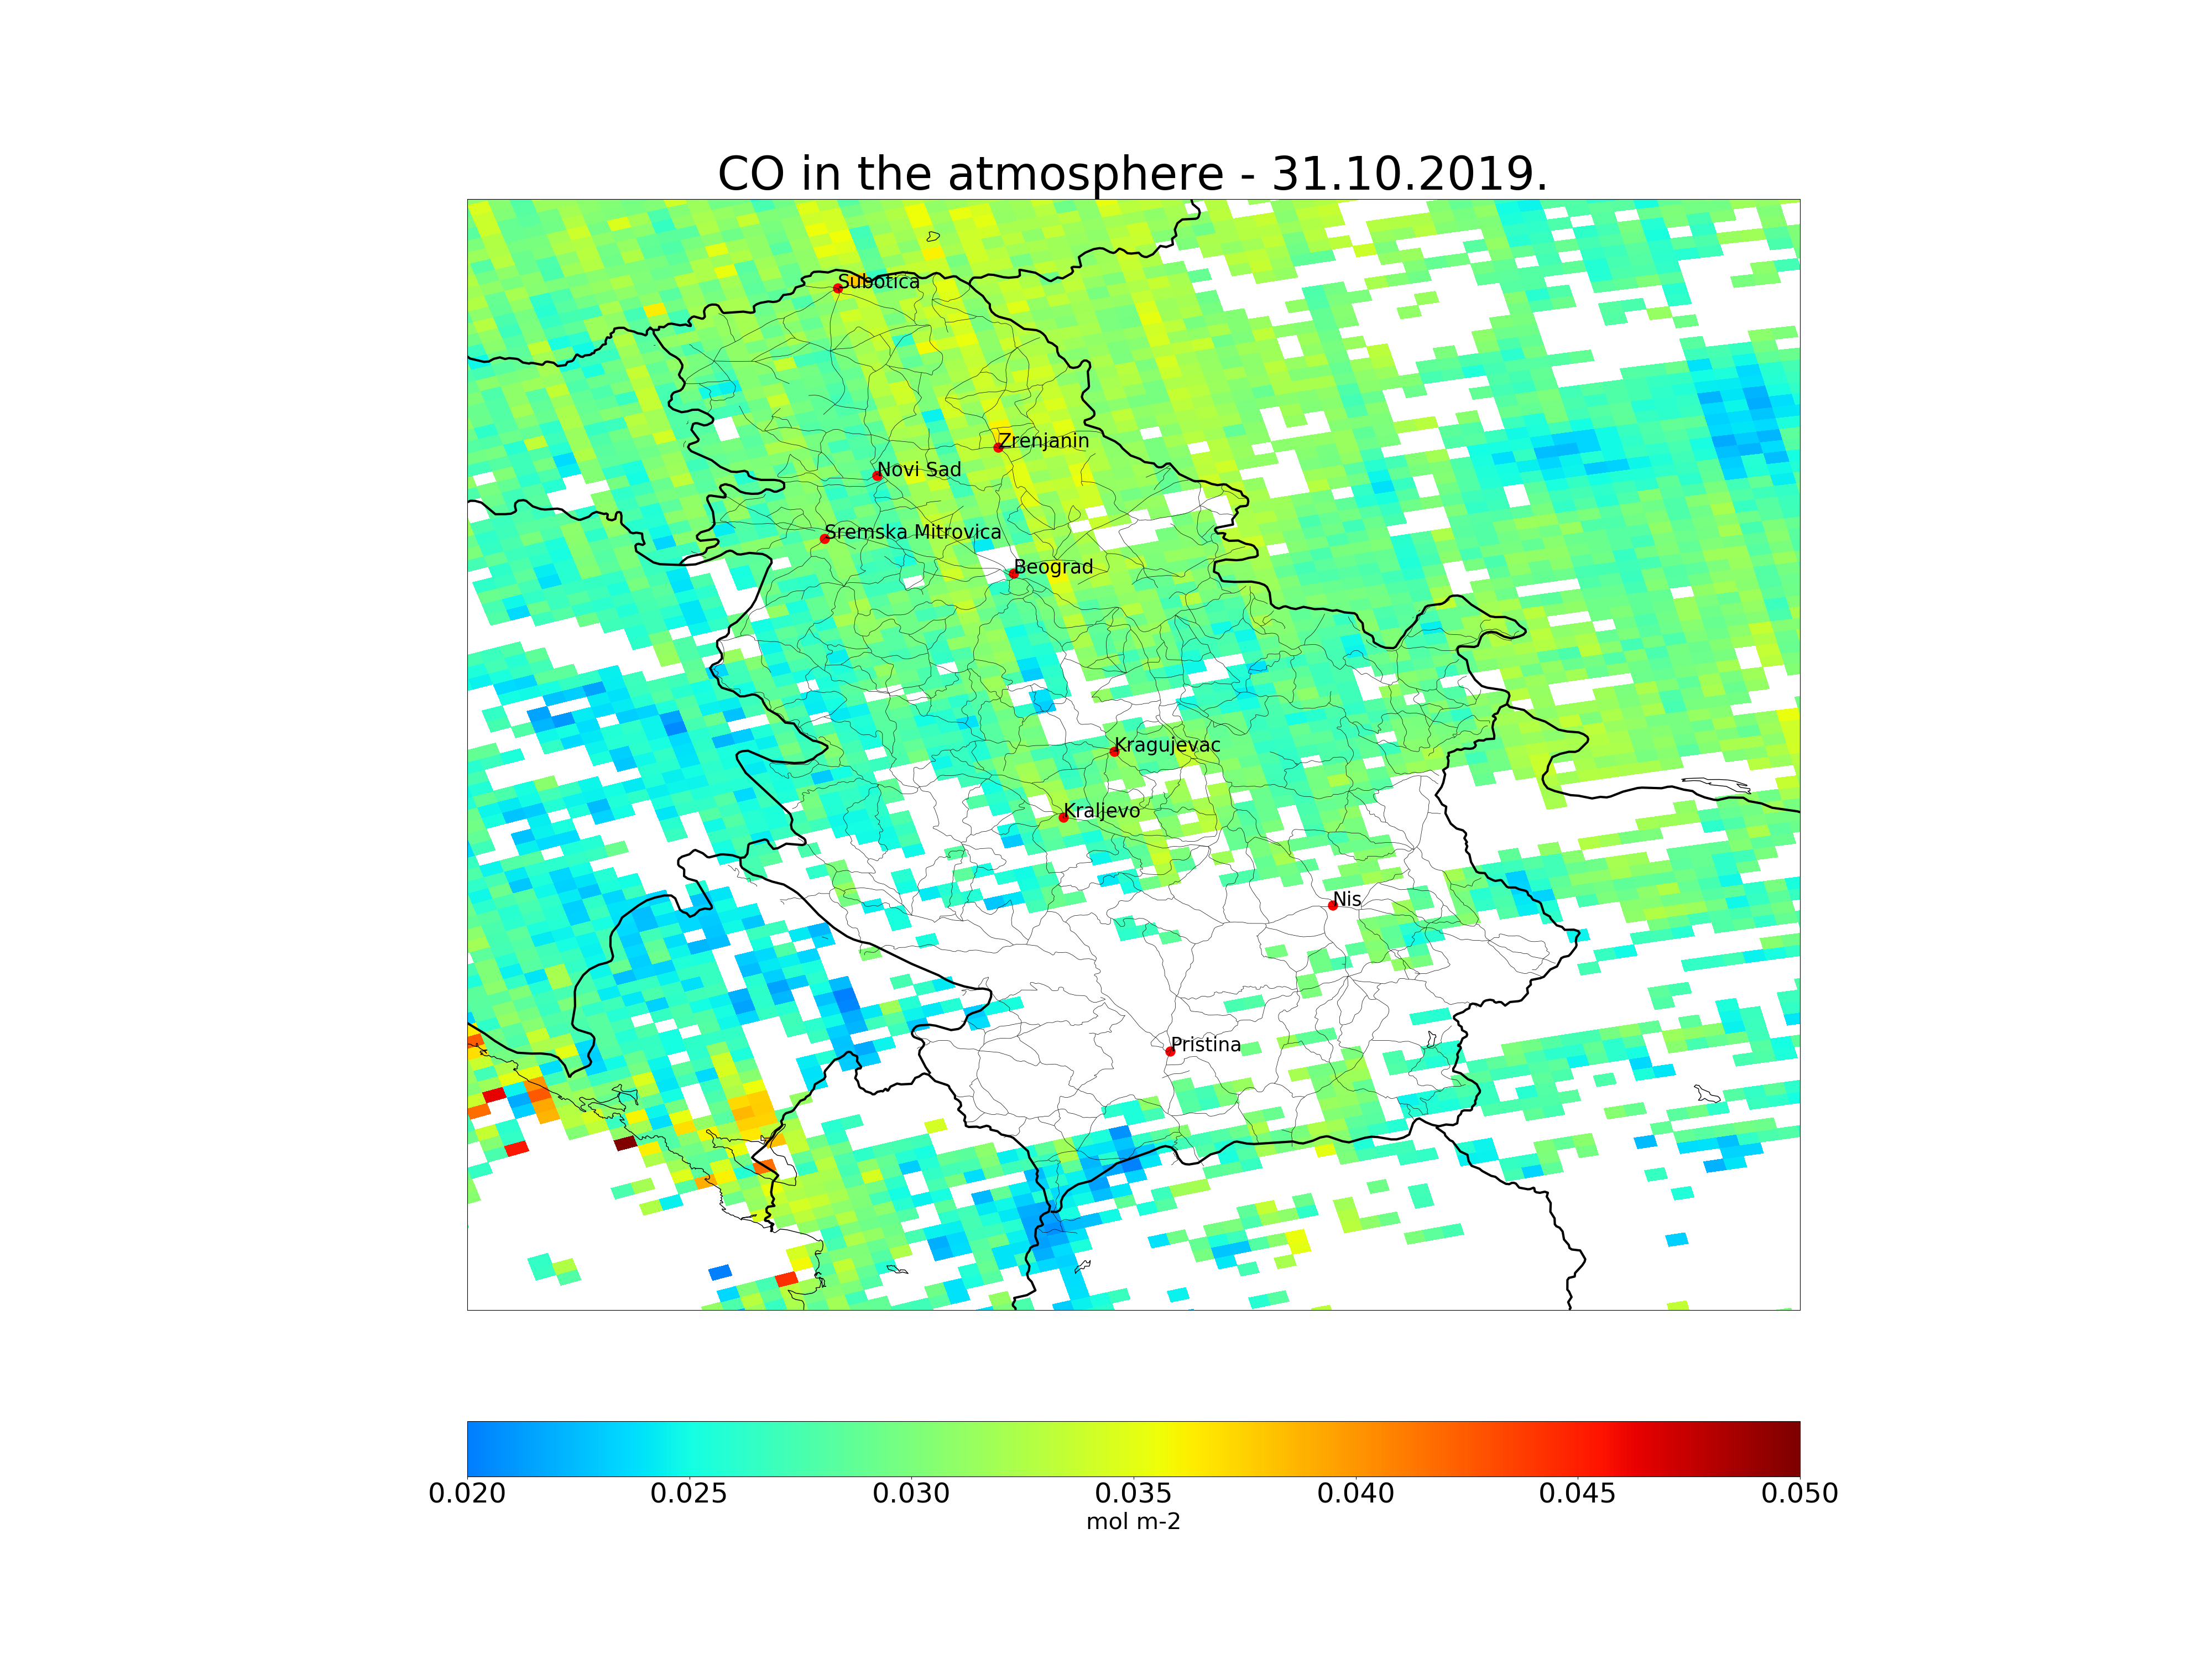
Because I bumped into some images in which some pixels didn’t have the values (picture below), I need to ask is it possible that there is some mistake with the data, or does the data need some kind of processing or did I do something wrong?
Concrete image name that I am talking about is: S5P_OFFL_L2__NO2____20191029T110435_20191029T124605_10585_01_010302_20191104T134533.nc
Thank you in advance!