# About the HARP category
**URL:** https://forum.atmospherictoolbox.org/t/about-the-harp-category/13
**Category:** HARP
**Created:** [April 11, 2019, 7:39am UTC](https://forum.atmospherictoolbox.org/t/about-the-harp-category/13 "2019-04-11T07:39:50Z")
**Posts on this page:** 16
**Page:** 1
### Author:  [@sander.niemeijer](https://forum.atmospherictoolbox.org/u/sander.niemeijer)
#### Post date: [April 11, 2019, 7:39am UTC](https://forum.atmospherictoolbox.org/t/about-the-harp-category/13/1 "2019-04-11T07:39:50Z")
Discussions about the HARP software: support, examples, development ideas, etc.
---
### Author:  [@EduK](https://forum.atmospherictoolbox.org/u/EduK)
#### Post date: [January 7, 2020, 8:12pm UTC](https://forum.atmospherictoolbox.org/t/about-the-harp-category/13/2 "2020-01-07T20:12:28Z")
Hello
I want to export a NetCDF file to raster to use it on Qgis or Arcmap…
File: (S5P\_NRTI\_L2\_\_NO2\_\_\_\_20191217T181608\_20191217T182108\_11284\_01\_010302\_20191217T190947.nc )
Id already installed Anaconda, Visan and HARP. (Windows64)

When i open the environment with pyton and put the “harpconvert -a bin\_spatial” command but always have syntax error.
Help please!!
---
### Author:  [@sander.niemeijer](https://forum.atmospherictoolbox.org/u/sander.niemeijer)
#### Post date: [January 8, 2020, 9:20am UTC](https://forum.atmospherictoolbox.org/t/about-the-harp-category/13/3 "2020-01-08T09:20:09Z")
Note that bin\_spatial is a function that requires arguments.
You will need to give the information on the target grid you want.
There is actually a whole sequence of operations that you might want to perform in order to efficiently convert the product to a file that can be used in qgis. This includes applying the quality filter, removing unneeded variables, etc.
An example convert for the file that you provided (i.e. the parameters to bin\_spatial are tailored for this specific O3 file) is:
`harpconvert -a 'tropospheric_NO2_column_number_density_validity>75;keep(latitude_bounds,longitude_bounds,tropospheric_NO2_column_number_density);bin_spatial(2400,-37,0.01,3300,-83,0.01);derive(tropospheric_NO2_column_number_density [Pmolec/cm2]);squash(time, (latitude_bounds,longitude_bounds));derive(latitude {latitude});derive(longitude {longitude});exclude(latitude_bounds,longitude_bounds,count,weight)' S5P_NRTI_L2 __NO2____ 20191217T181608_20191217T182108_11284_01_010302_20191217T190947.nc o3grid.nc`
If you use a different product then modify parameters to the bin\_spatial function accordingly.
See also the other forum threads such as [Map Sentinel 5p CH4, SO2 and CO Data (Visan)](https://forum.atmospherictoolbox.org/t/map-sentinel-5p-ch4-so2-and-co-data-visan/45/19) for more details.
---
### Author:  [@EduK](https://forum.atmospherictoolbox.org/u/EduK)
#### Post date: [January 9, 2020, 3:03pm UTC](https://forum.atmospherictoolbox.org/t/about-the-harp-category/13/4 "2020-01-09T15:03:04Z")
Hello svniemeijer
Verry thank you for the explanation.
Now i can export S5P data with HARP.
I have another question: I want to export the same S5P NO2 Data with the WPLOT Visan configuration to handle on Qgis.
This configuration, same size:
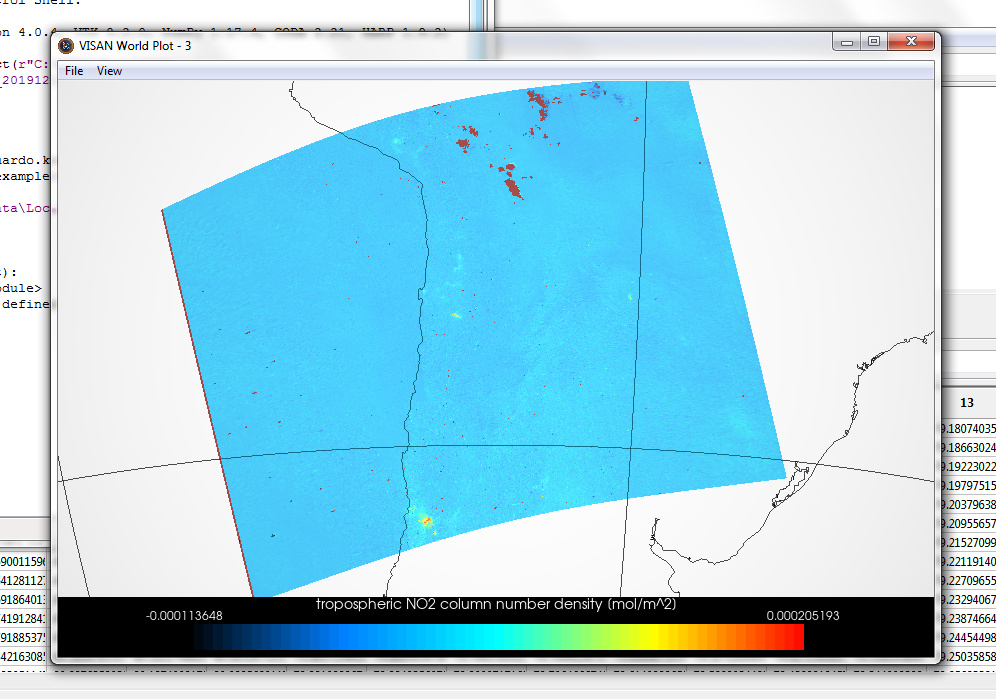
Can u help me with this bin\_spatial function please
Thank u for your explanation again.
Regards
---
### Author:  [@sander.niemeijer](https://forum.atmospherictoolbox.org/u/sander.niemeijer)
#### Post date: [January 9, 2020, 3:18pm UTC](https://forum.atmospherictoolbox.org/t/about-the-harp-category/13/5 "2020-01-09T15:18:33Z")
I am not entirely sure what you mean. Do you mean a plot without the filtering and unit conversion?
In that case use:
`harpconvert -a 'keep(latitude_bounds,longitude_bounds,tropospheric_NO2_column_number_density);bin_spatial(2400,-37,0.01,3300,-83,0.01);squash(time, (latitude_bounds,longitude_bounds));derive(latitude {latitude});derive(longitude {longitude});exclude(latitude_bounds,longitude_bounds,count,weight)' S5P_NRTI_L2 __NO2____ 20191217T181608_20191217T182108_11284_01_010302_20191217T190947.nc o3grid.nc`
---
### Author:  [@EduK](https://forum.atmospherictoolbox.org/u/EduK)
#### Post date: [January 9, 2020, 3:43pm UTC](https://forum.atmospherictoolbox.org/t/about-the-harp-category/13/6 "2020-01-09T15:43:43Z")
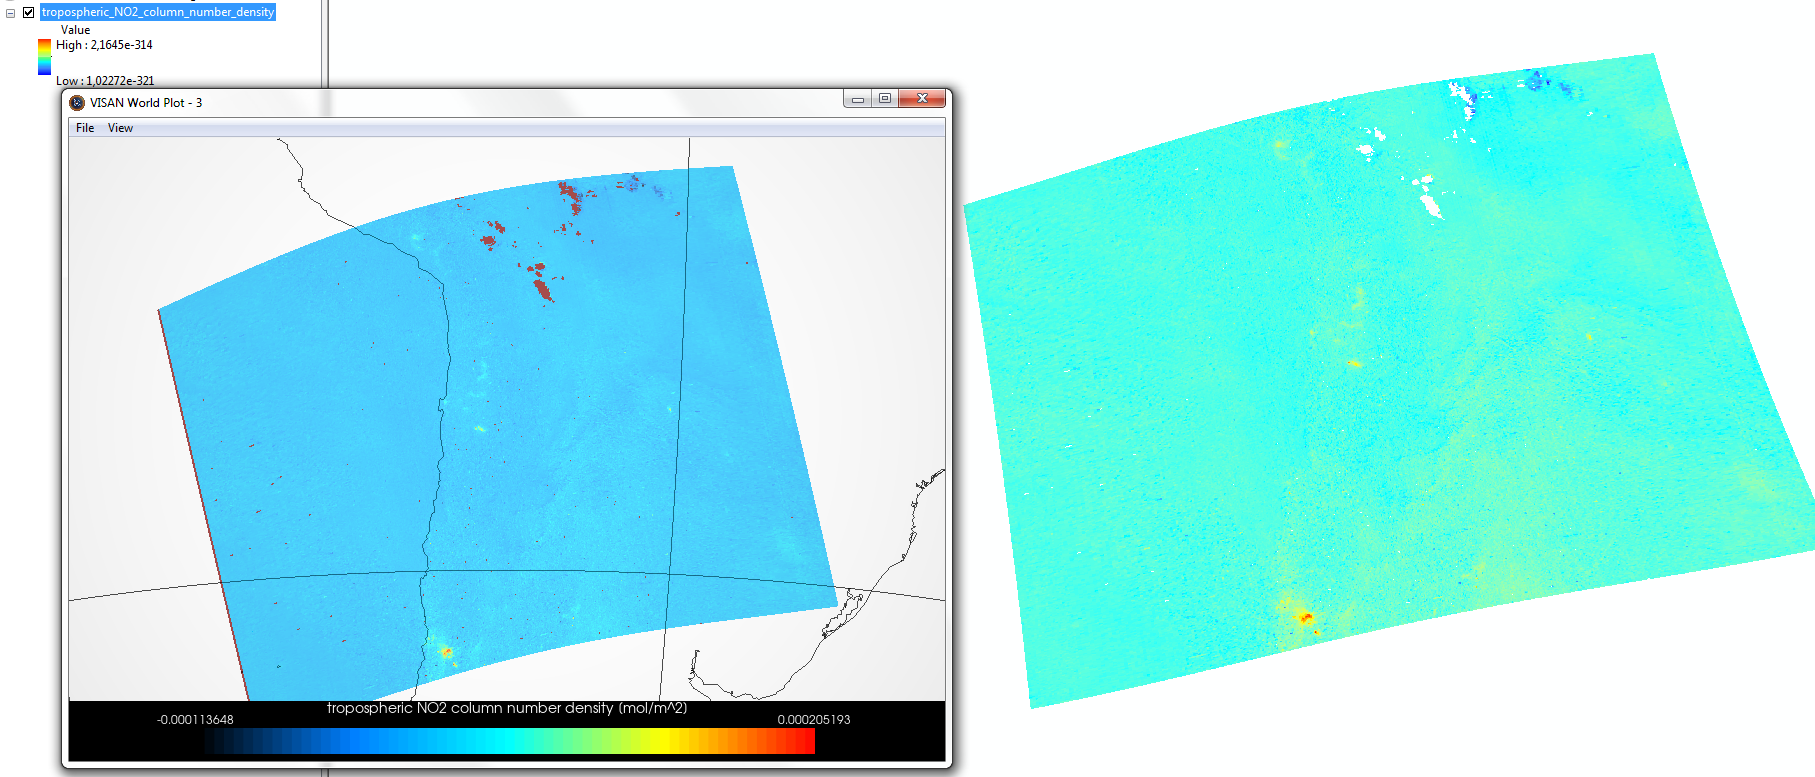
Thank you a lot !
Regards
---
### Author:  [@yuriale15](https://forum.atmospherictoolbox.org/u/yuriale15)
#### Post date: [February 8, 2020, 8:18pm UTC](https://forum.atmospherictoolbox.org/t/about-the-harp-category/13/7 "2020-02-08T20:18:04Z")
Hi I need obtain puntual information about sentinel 5p, and I’m used a similar code but I don’t be what are this numbers (2400,-37,0.01,3300,-83,0.01).
You can help my.
---
### Author:  [@sander.niemeijer](https://forum.atmospherictoolbox.org/u/sander.niemeijer)
#### Post date: [February 8, 2020, 8:32pm UTC](https://forum.atmospherictoolbox.org/t/about-the-harp-category/13/8 "2020-02-08T20:32:24Z")
The meaning of the values are explained in the [HARP documentation](http://stcorp.github.io/harp/doc/html/operations.html) for the bin\_spatial operation.
The parameters are: lat\_edge\_length, lat\_edge\_offset, lat\_edge\_step, lon\_edge\_length, lon\_edge\_offset, and lon\_edge\_step.
---
### Author:  [@liupeiID](https://forum.atmospherictoolbox.org/u/liupeiID)
#### Post date: [May 29, 2020, 6:33am UTC](https://forum.atmospherictoolbox.org/t/about-the-harp-category/13/9 "2020-05-29T06:33:27Z")
Thanks for your explaination. but, I am still confused about these parameters. I mean, for instance, the dataset I have named ‘S5P\_OFFL\_L2\_\_NO2\_\_\_\_20200301T035508\_20200301T053638\_12340\_01\_010302\_20200304T083242.nc’, I do not know how to obtain or calculate these six parameters?
who can give me a hand? Many many thanks!
---
### Author:  [@sander.niemeijer](https://forum.atmospherictoolbox.org/u/sander.niemeijer)
#### Post date: [May 29, 2020, 6:45am UTC](https://forum.atmospherictoolbox.org/t/about-the-harp-category/13/10 "2020-05-29T06:45:41Z")
What is the range and resolution that you want for your latitude/longitude grid?
---
### Author:  [@liupeiID](https://forum.atmospherictoolbox.org/u/liupeiID)
#### Post date: [May 29, 2020, 6:57am UTC](https://forum.atmospherictoolbox.org/t/about-the-harp-category/13/11 "2020-05-29T06:57:29Z")
Hi thanks for your reply, spatial resolution is 7000m\*3500m, and latitude/longitude grid? I’m not sure, how about worldwide, sorry for this stupid question, I’m freshman for this sensor data. how about one degree?
---
### Author:  [@sander.niemeijer](https://forum.atmospherictoolbox.org/u/sander.niemeijer)
#### Post date: [May 29, 2020, 7:22am UTC](https://forum.atmospherictoolbox.org/t/about-the-harp-category/13/13 "2020-05-29T07:22:50Z")
If you want a worldwide 1x1 degree grid then you would use `bin_spatial(181,-90,1,361,-180,1)`: latitude starts at -90 with 1 degree steps (ending up after (181 - 1) steps at 90) and longitude starts at -180 with 1 degree steps (ending up after (361 - 1) steps at 180).
---
### Author:  [@liupeiID](https://forum.atmospherictoolbox.org/u/liupeiID)
#### Post date: [May 29, 2020, 8:15am UTC](https://forum.atmospherictoolbox.org/t/about-the-harp-category/13/14 "2020-05-29T08:15:59Z")
Hi many thanks! it works. another question, how do you know, this variable ‘tropospheric\_NO2\_column\_number\_density’, I tried gdalinfo to obtain meta data of my data, but I can’t find a variable named ‘tropospheric\_NO2\_column\_number\_density’, so where could I find useful variable or what varialbe could I change to ?
I observed meta data of this ‘‘S5P\_OFFL\_L2\_\_NO2\_\_\_\_20200301T035508\_20200301T053638\_12340\_01\_010302\_20200304T083242.nc’’ use gdalinfo, matlab’s function ncinfo
I also browse document of S5P named ‘Sentinel-5P-L01B-metadata-specifications.pdf’, ‘Sentinel-5P-Level-2-Product-User-Manual-Nitrogen-Dioxide.pdf’, ‘Sentinel-5P-Nitrogen-Dioxide-Level-2-Product-Readme-File.pdf’
while, I can not find a variable named ‘tropospheric\_NO2\_column\_number\_density’, so why it is ‘‘tropospheric\_NO2\_column\_number\_density’’ here?
Kind regards,
---
### Author:  [@sander.niemeijer](https://forum.atmospherictoolbox.org/u/sander.niemeijer)
#### Post date: [May 29, 2020, 8:29am UTC](https://forum.atmospherictoolbox.org/t/about-the-harp-category/13/15 "2020-05-29T08:29:15Z")
HARP actually performs a conversion of the S5P data to make everything more harmonised (and so it becomes easier to compare against other atmospheric data instruments).
The full mapping of the conversion that HARP performs can be found in the documentation. For S5P NO2 it is the Mapping description section of [this page](http://stcorp.github.io/harp/doc/html/ingestions/S5P_L2_NO2.html).
---
### Author:  [@Felicidad](https://forum.atmospherictoolbox.org/u/Felicidad)
#### Post date: [April 18, 2023, 11:48am UTC](https://forum.atmospherictoolbox.org/t/about-the-harp-category/13/16 "2023-04-18T11:48:22Z")
Thank you for your response. I was downloaded NO2 data over India region having West=67 degree, East= 98 degree, South= 5.0 degree and North=38.0 degree. The dataset is “S5P\_OFFL\_L2\_\_NO2\_\_\_\_20181101T054736\_20181101T072905\_05446\_01\_010200\_20181107T073552.nc”. what will be the bin\_spatial() six parameters if I will have to draw a map over this coordinates.
Thanks
---
### Author:  [@sander.niemeijer](https://forum.atmospherictoolbox.org/u/sander.niemeijer)
#### Post date: [April 18, 2023, 12:15pm UTC](https://forum.atmospherictoolbox.org/t/about-the-harp-category/13/17 "2023-04-18T12:15:19Z")
For NO2 a 0.02 degree resolution would be ok. You would then use (38-5)/0.02 + 1 = 1651 latitude edge points and (98-67)/0.02 + 1 = 1551 longitude edge points: `bin_spatial(1651, 5, 0.02, 1551, 67, 0.02)`