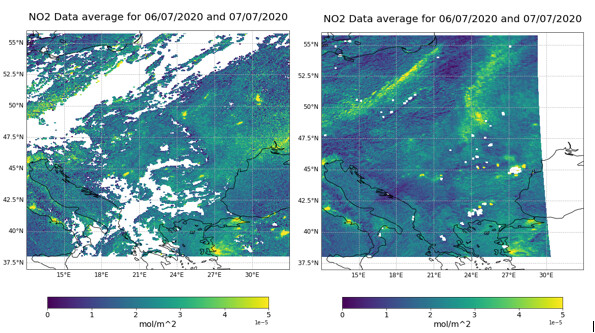
I downloaded NO2 Sentinel 5P data for 6th and 7th of July 2020 for a specific location and performed harp ingest on it. Then I extracted Google Earth NO2 data for the same location and time. When I created a visualisation for both the products to make sure they are same, the visualisations look different.
The image on the left is the Google Earth NO2 data visualisation and the image on the right is the harp NO2 data visualisation:
My question is, if google earth data are already harp products then why do these visualisations look different? How can I verify the harp products generated from a netCDF file if they do not match the google earth data?
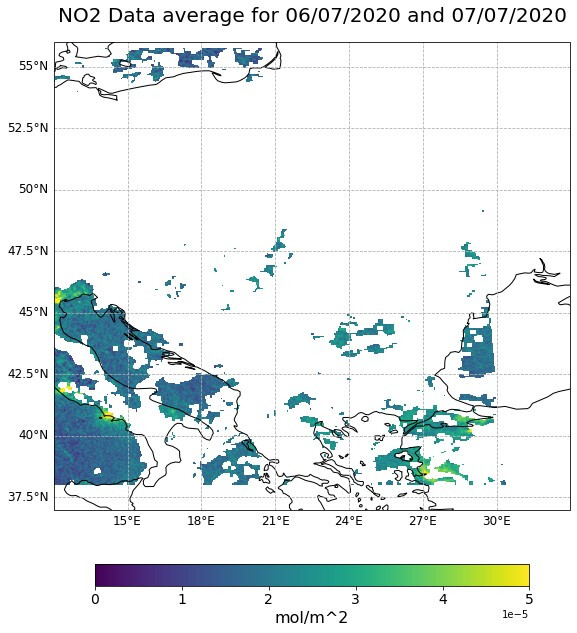
This is because Google is applying the quality filtering as prescribed by the product readme file. You should do the same by applying a filtering on the tropospheric_NO2_column_number_density_validity variable (which is also what Google is doing). I would strongly suggest that you read the other threads on this forum. There are many that deal with reading S5P NO2 data with HARP.
So I assumed may be cloud filtering was not done on the google earth data. Why do these visualisations look so different? I followed everything exactly like the readme file.
Thanks
PS - I passed ‘tropospheric_NO2_column_number_density_validity > 75’ into harp import product function operations.
Have you looked at Sentinel-5P OFFL NO2: Offline Nitrogen Dioxide? Google has documented quite well how they create their data products. They are using >50 as qa_value threshold (which means they also include cloud covered scenes).
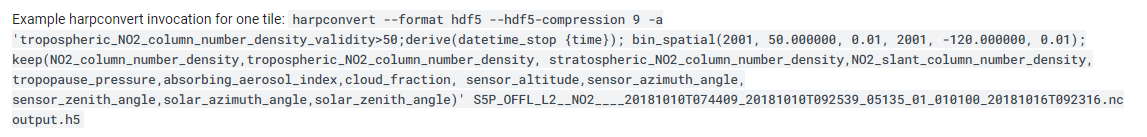
I have looked at the google documentation and followed the exact same harp conversion but the visualisation still doesn’t match. This is what my operations parameter in harp import_product function looks like:
I am still not sure why are the visualisations different when I’m doing the exact same thing. On changing the validity filter to > 50 instead of > 75 I’m getting the same visualisation I got in the first graph I posted. So I still have the same issue.
I checked myself, and it seems google is using the > 75 filter (so their documentation is off).
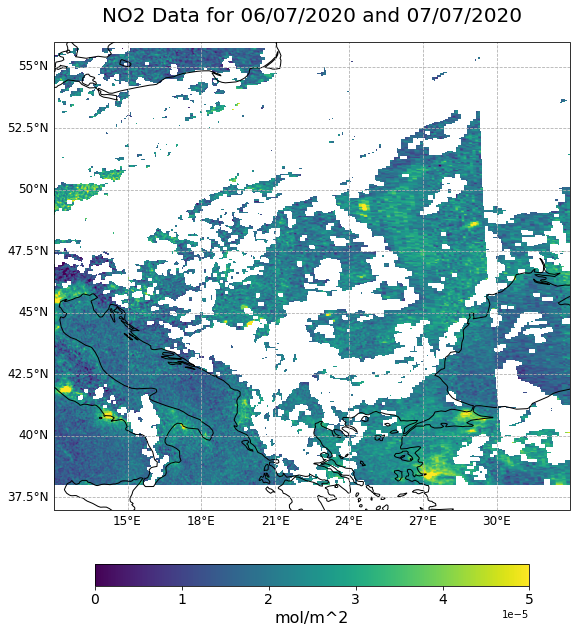
You seem to be only looking at 1 orbit, which is from 2020-07-07. But you need to merge everything from both 2020-07-06 and 2020-07-07.
If I combine the two main orbits S5P_OFFL_L2__NO2____20200706T110830_20200706T125000_14146_01_010302_20200708T040350.nc and S5P_OFFL_L2__NO2____20200707T104926_20200707T123056_14160_01_010302_20200709T034441.nc and use:
I tried it, I got an error that reduction_operations does not exist but when I removed it and ran it again, I got something pretty close to the actual data. Thank you!