Creating L3 grids for south hemisphere for sentinel-5p No2 using HARP in python

Hi there,
I am trying do some operations using HARP in python.
Here is a snippet of the codes I am using.

for i in input_files_OFFL:
    harp_L2_L3 =harp.import_product(i, operations=" \
                      tropospheric_NO2_column_number_density_validity>75; \
                      derive(tropospheric_NO2_column_number_density [Pmolec/cm2]);\
                      derive(datetime_stop {time});\
                      latitude > -4.6 [degree_north] ; latitude < -1.0 [degree_north]; longitude > 28.6 [degree_east] ; longitude < 34.7 [degree_east];\
                      bin_spatial(360, -4.6, 0.01,610, 28.6, 0.01);\
                      derive(latitude{latitude}); derive(longitude {longitude});\
                      keep(NO2_column_number_density, tropospheric_NO2_column_number_density, stratospheric_NO2_column_number_density, NO2_slant_column_number_density,tropopause_pressure, absorbing_aerosol_index,cloud_fraction)")          
    export_folder = "{export_path}/{name}".format(export_path=export_path, name=i.split('\\')[-1].replace('L2', 'L3'))
    harp.export_product(harp_L2_L3, export_folder, file_format= 'netcdf') 

when I try to visualize the exported files , the output looks like this :

I would appreciate for your help.

What’s the question?

Thank you @priyapatel1 for replying. The question is how to include south hemisphere No2 in the exported data.

Hi,

If you want to include the Southern hemisphere, then set the filter values on latitude and longitude accordingly (latitude > -90 [degree_north] ; latitude < 90 [degree_north]; longitude > -180 [degree_east] ; longitude < 180 [degree_east];). or you can simply remove those filters.

Then in your bin_spatial() operation, you need to change the values of the latitude_offset and longitude offset and adapt the number of steps accordingly e.g: bin_spatial(18000, -90, 0.01,36000, -180, 0.01);

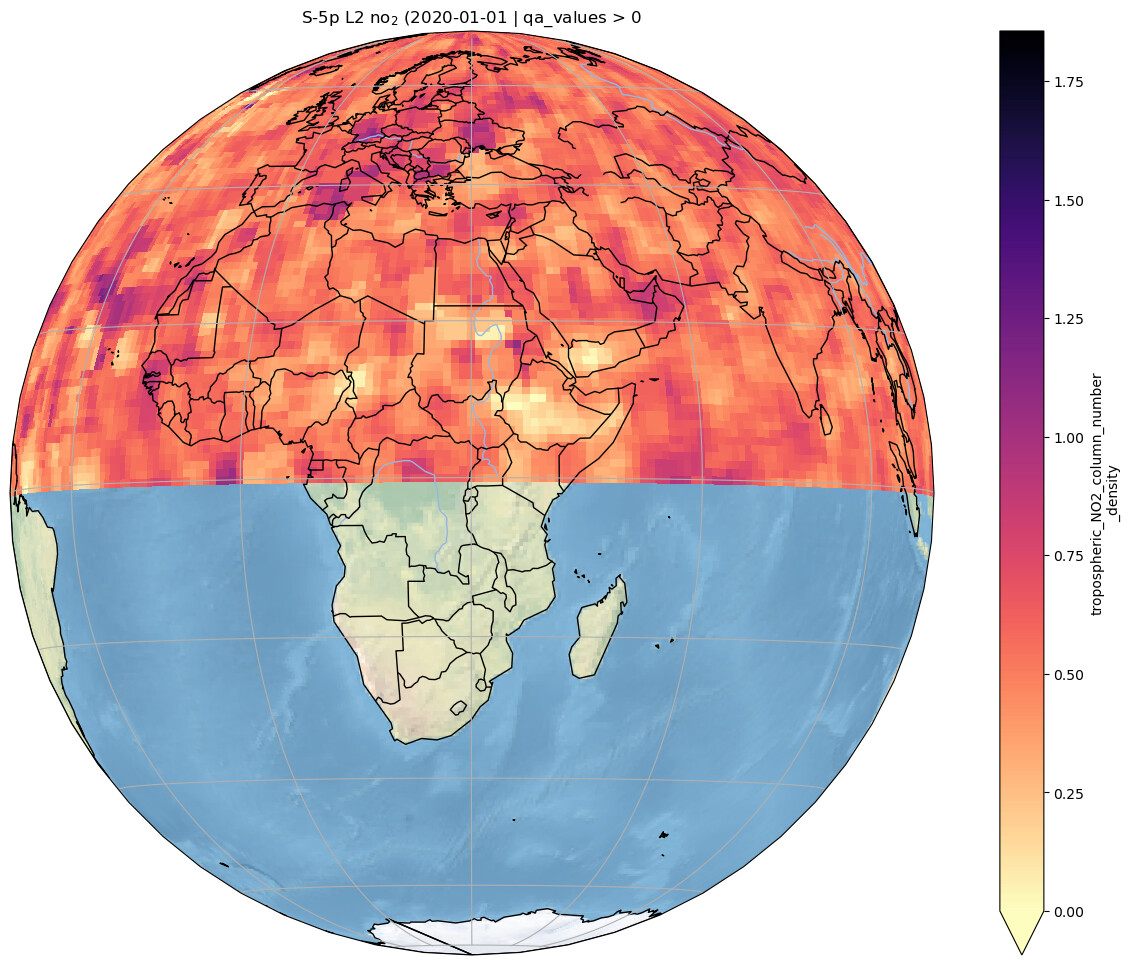
With the code written in your question, I am even surprised that you managed to generate a map over the full Northern hemisphere.

The HARP operations that are performed look Ok to me. My guess is that something is going wrong with the plotting. Could you perhaps clarify how you created the plots from the exported files? Because it is very likely that your problem is somewhere in those operations.

Thanks @simonB NS @sander.niemeijer for replying.
Actually, I was plotting the exported files using the matplotlib and cartopy libraries in python.

I got my issue solved after including the “latitude” and “longitude” variables in the “keep” command of HARP.

@sishimwe can you please explain me how your code worked in the first place? I am trying to do the exact same thing for L2_NO2 data but neither am I able to save the L3 files via this code nor am I able to move further while visualizing the data. It would be extremely helpful if you can share your export_path variable too (in the sense, what is the file path that you added in export_path)
Thanks!