I had tried to draw a histogram plot of the harp import product in a plot window using:
histogramplot(product, bins)
but I don’t know exactly how to run this function. I tried to give a different number of bins, for ex.
histogramplot(pro, ‘bins=100’),
and I always get this error:
Traceback (most recent call last):
File “”, line 1, in
File “C:\Users\yosef\anaconda3\lib\site-packages\visan\commands.py”, line 63, in histogramplot
x = numpy.transpose(numpy.reshape(numpy.concatenate([bins[:-1], bins[1:]]), (2, len(bins) - 1))).ravel()
IndexError: too many indices for array
Could you please by an example how to run this function to plot a histogram of the output data.
There is a histogram.py example script that comes with VISAN that shows you how to use the histogram plot. bins needs to be a numpy array containing the edge positions of the bins.
Thank you very much for your answer. I saw this example and tried to run it after changing with name of my output file, but it is not run. I see this error:
File “”, line 3
from visan.math import histogram
^
SyntaxError: multiple statements found while compiling a single statement
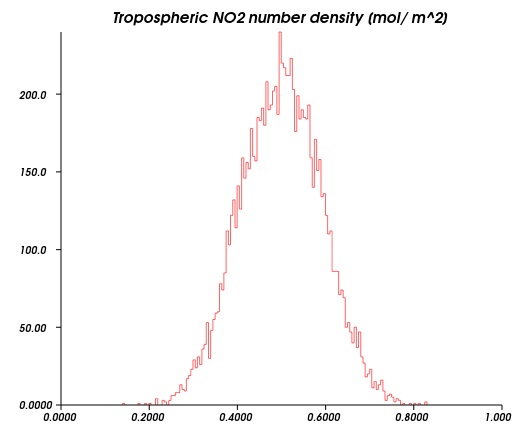
I am so sorry for my late answer, I wasn’t paying attention to your question. Yes, I have run the script using this command, but I don’t know how to change the data on the x-axis to explain the tropospheric NO2 number density. Another problem is how to draw a histogram for each range separately as they are shown in the color bars.
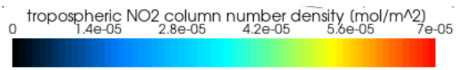
for ex. in the attached figure, the tropospheric NO2 number density in the range [0 7e-05]
Thanks so much for your help. I really appreciate this.
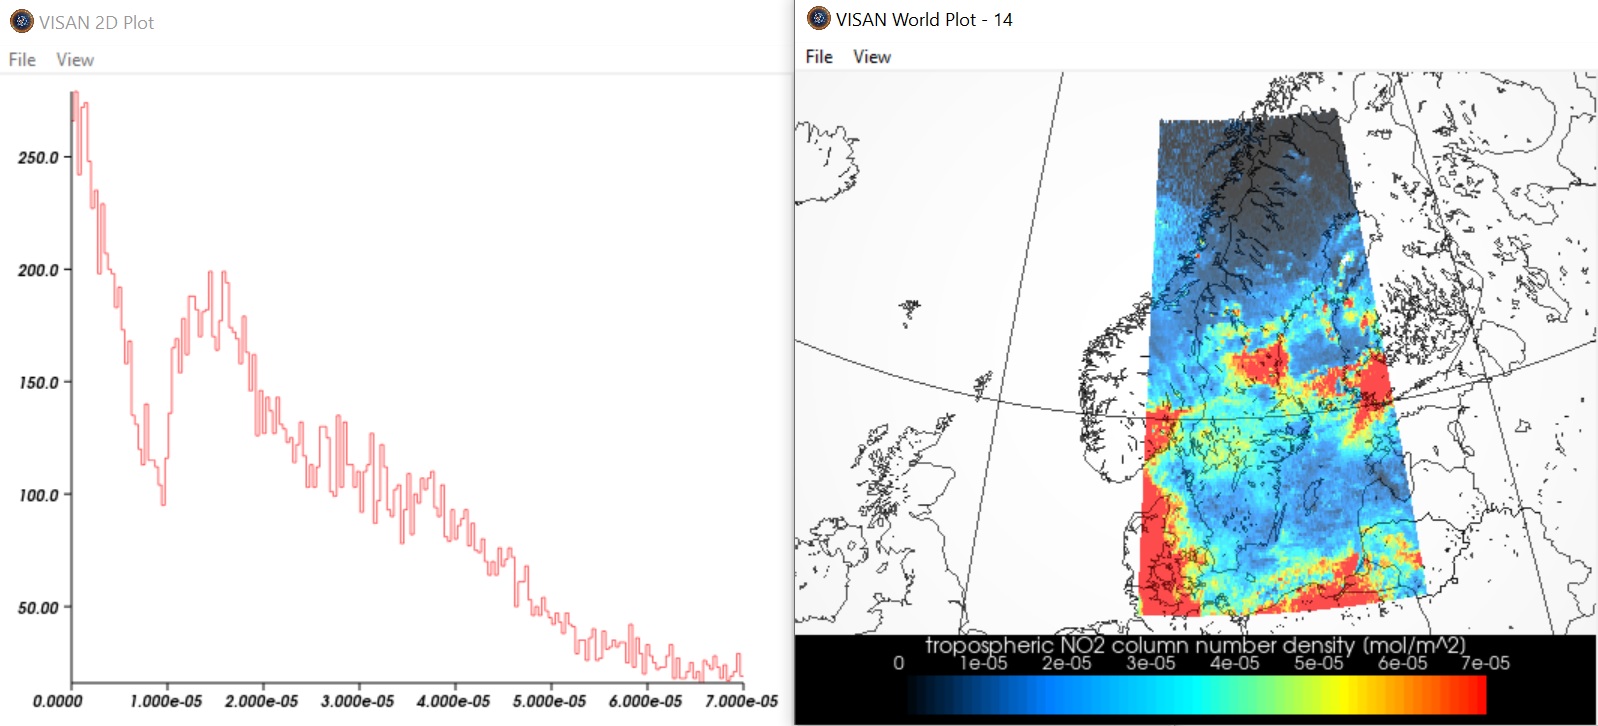
I have plotted a histogram for the product but what I see is inconsistent with the information on the image,
for ex. the tropospheric NO2 column number density in the range [6e-05 7e-05] looks less than the range in [5e-05 6e-05], while the image on the left shows the opposite.
Excuse me, do you any suggestions about that?
Yes, there is a lot of values above 7e-05, but I have selected this range to show the most clear image of the tropospheric NO2 column number density over Sweden on 1 March 2020, and I want to explain this in a histogram also. Do you an idea how to show this?
Excuse me, is there is any way to export the product as a numerical values, for example to save the output as a matrix of two columns, the first column contains the tropospheric NO2 column number density and the second column contains contains the accounts numbers. Or as a text file. It will easy to work with the data in any other analysing program.
HARP already has direct interfaces for many analysis applications (python, R, matlab, idl).
If you want to convert to something like .csv then first export the file using HARP to netcdf or hdf5 and then use something like described here to convert into other formats.
Using your notes I finished the monthly average histogram of the products, but the plot will be displayed on the visan window and I need to export the histogram to the python window for further processing.
You cannot display graphs in the python console.
You might be referring to python notebooks. But if you want to use that, then just use python notebooks directly with HARP and something like matplotlib.