After extracting the coordinates from the product metadata and arranging it into a list I get:
((45.154247, 119.67357),
(46.845333, 121.03921),
(48.51579, 122.50277),
(50.16308, 124.074814),
(51.784256, 125.767334),
(53.375854, 127.593956),
(54.93387, 129.5701),
(56.453674, 131.71194),
(57.92967, 134.03885),
(59.355755, 136.57037),
(60.724674, 139.32736),
(62.027946, 142.332),
(63.256054, 145.60516),
(64.398315, 149.1658),
(65.44262, 153.02882),
(66.37613, 157.20143),
(67.18522, 161.68002),
(67.85633, 166.44713),
(68.376595, 171.46803),
(68.73491, 176.68976),
(68.92327, -177.9573),
(68.93687, -172.55469),
(68.7755, -167.18857),
(68.443115, -161.94177),
(67.94735, -156.88625),
(67.29887, -152.07722),
(66.51049, -147.55257),
(65.595535, -143.3323),
(64.567856, -139.42177),
(63.440296, -135.81503),
(62.22504, -132.49861),
(60.93313, -129.45386),
(59.574245, -126.659805),
(58.156925, -124.09468),
(56.68866, -121.73724),
(55.175667, -119.5676),
(53.62378, -117.56656),
(52.037598, -115.71728),
(50.42116, -114.004524),
(48.7781, -112.41413),
(47.1114, -110.93403),
(45.42381, -109.553024),
(43.717434, -108.26171),
(41.994366, -107.051216),
(40.25641, -105.91394),
(38.50504, -104.84301),
(36.741394, -103.83293),
(34.966896, -102.87781),
(33.182552, -101.97292),
(31.38931, -101.11413),
(29.58787, -100.29776),
(27.778975, -99.52048),
(25.963507, -98.778885),
(24.14186, -98.070694),
(22.314709, -97.39304),
(20.48248, -96.744095),
(18.645742, -96.121605),
(16.804811, -95.52389),
(14.960076, -94.949425),
(13.111927, -94.3966),
(11.26071, -93.86419),
(9.406724, -93.351006),
(7.5502887, -92.85586),
(5.6916103, -92.37787),
(3.8310509, -91.91616),
(1.968744, -91.46994),
(0.10495859, -91.03856),
(-1.7600541, -90.62111),
(-3.6260984, -90.217186),
(-5.493023, -89.82644),
(-7.3605785, -89.448135),
(-9.22869, -89.0823),
(-11.097062, -88.72814),
(-12.965643, -88.385635),
(-14.834206, -88.05445),
(-16.702625, -87.73457),
(-18.570791, -87.42558),
(-20.438416, -87.127754),
(-22.305588, -86.84095),
(-24.172117, -86.565445),
(-26.037745, -86.30077),
(-27.902737, -86.048096),
(-29.766478, -85.806496),
(-31.629223, -85.57715),
(-33.490734, -85.36021),
(-35.350983, -85.15653),
(-37.209877, -84.96657),
(-39.067196, -84.790924),
(-40.923077, -84.630806),
(-42.777252, -84.487404),
(-44.62972, -84.36219),
(-46.480392, -84.256714),
(-48.32907, -84.17275),
(-50.175816, -84.113304),
(-52.020435, -84.08061),
(-53.86276, -84.07897),
(-55.702713, -84.11183),
(-57.540134, -84.18562),
(-59.37466, -84.30592),
(-61.20618, -84.48135),
(-63.034313, -84.72287),
(-64.85858, -85.04391),
(-66.678345, -85.462425),
(-68.492935, -86.00242),
(-70.30109, -86.69637),
(-72.101425, -87.58867),
(-73.89152, -88.74611),
(-75.66804, -90.26319),
(-77.4256, -92.287254),
(-77.716125, -92.68896),
(-77.72833, -92.27399),
(-77.840775, -84.61106),
(-77.58821, -72.35083),
(-77.18361, -65.13743),
(-76.68611, -59.099934),
(-76.25827, -54.991444),
(-75.78745, -51.142197),
(-75.38962, -48.269863),
(-74.94513, -45.368332),
(-74.558914, -43.05807),
(-74.15006, -40.78874),
(-74.11242, -40.58793),
(-73.709625, -38.515705),
(-73.22472, -36.188194),
(-72.76765, -34.13902),
(-72.18967, -31.72253),
(-71.61333, -29.484955),
(-70.83308, -26.699516),
(-69.98643, -23.961155),
(-68.70218, -20.299837),
(-67.06496, -16.348957),
(-65.58033, -13.320927),
(-65.58033, -13.320927),
(-64.56785, -17.2311),
(-63.455616, -20.841757),
(-62.255627, -24.166136),
(-60.97866, -27.22156),
(-59.634274, -30.028065),
(-58.231125, -32.60701),
(-56.77655, -34.97899),
(-55.276833, -37.163925),
(-53.737698, -39.180073),
(-52.16376, -41.044346),
(-50.559277, -42.77225),
(-48.927708, -44.377487),
(-47.272083, -45.871933),
(-45.59506, -47.26704),
(-43.898968, -48.572075),
(-42.185806, -49.79573),
(-40.45735, -50.945942),
(-38.715115, -52.029285),
(-36.960487, -53.051823),
(-35.194603, -54.018837),
(-33.4186, -54.935455),
(-31.633278, -55.805458),
(-29.839544, -56.632828),
(-28.038218, -57.421303),
(-26.229906, -58.173428),
(-24.41527, -58.892235),
(-22.594791, -59.580193),
(-20.769045, -60.23931),
(-18.9385, -60.87214),
(-17.103544, -61.47985),
(-15.264486, -62.064323),
(-13.422023, -62.62739),
(-11.576046, -63.169685),
(-9.727102, -63.69292),
(-7.875425, -64.19801),
(-6.0214553, -64.68619),
(-4.165145, -65.15811),
(-2.3070114, -65.61475),
(-0.44709745, -66.056786),
(1.4142969, -66.484695),
(3.276973, -66.899414),
(5.1407504, -67.30129),
(7.0054536, -67.69079),
(8.870922, -68.06848),
(10.736962, -68.43458),
(12.603467, -68.7894),
(14.47019, -69.133286),
(16.337086, -69.46631),
(18.20399, -69.78891),
(20.070774, -70.10101),
(21.937365, -70.402405),
(23.803625, -70.69359),
(25.669443, -70.97437),
(27.534664, -71.244354),
(29.39928, -71.50352),
(31.26316, -71.75164),
(33.126232, -71.98852),
(34.988415, -72.21344),
(36.8496, -72.42606),
(38.709812, -72.62541),
(40.56886, -72.81114),
(42.426743, -72.981865),
(44.283367, -73.13672),
(46.138756, -73.27415),
(47.9927, -73.39245),
(49.84517, -73.489555),
(51.6962, -73.56303),
(53.54556, -73.60979),
(55.39317, -73.626465),
(57.238953, -73.608185),
(59.082703, -73.5494),
(60.92428, -73.44286),
(62.763355, -73.27973),
(64.59973, -73.04802),
(66.432816, -72.73263),
(68.26213, -72.312904),
(70.086845, -71.76125),
(71.905846, -71.03845),
(73.717285, -70.08798),
(75.51872, -68.827415),
(77.30623, -67.12778),
(79.07308, -64.779854),
(80.80769, -61.42689),
(82.48791, -56.414154),
(84.067665, -48.47269),
(85.44124, -35.116985),
(86.36732, -12.749498),
(86.47327, 16.824577),
(85.69809, 41.40333),
(84.396034, 56.463005),
(82.84921, 65.33879),
(81.185135, 70.860985),
(79.45905, 74.5117),
(77.696815, 77.04446),
(75.91165, 78.86588),
(74.11121, 80.21039),
(72.29971, 81.22076),
(70.48017, 81.9879),
(68.65432, 82.57327),
(66.82349, 83.018776),
(64.988525, 83.35461),
(63.150116, 83.60224),
(61.308693, 83.77868),
(59.464634, 83.8959),
(57.61816, 83.96353),
(55.769524, 83.989174),
(53.919014, 83.978386),
(52.066616, 83.9367),
(51.757725, 83.92702),
(51.743507, 84.057816),
(51.43171, 86.64428),
(50.87817, 90.41686),
(50.483963, 92.75794),
(50.108562, 94.84338),
(49.827972, 96.35039),
(49.54647, 97.84077),
(49.324776, 99.00938),
(49.090702, 100.24454),
(48.896862, 101.27091),
(48.699726, 102.31924),
(48.68195, 102.41402),
(48.495235, 103.41211),
(48.278103, 104.57891),
(48.07994, 105.64904),
(47.83675, 106.96661),
(47.600548, 108.244934),
(47.287098, 109.92333),
(46.95004, 111.68031),
(46.433727, 114.22599),
(45.74974, 117.28473),
(45.154247, 119.67357),
(45.154247, 119.67357))
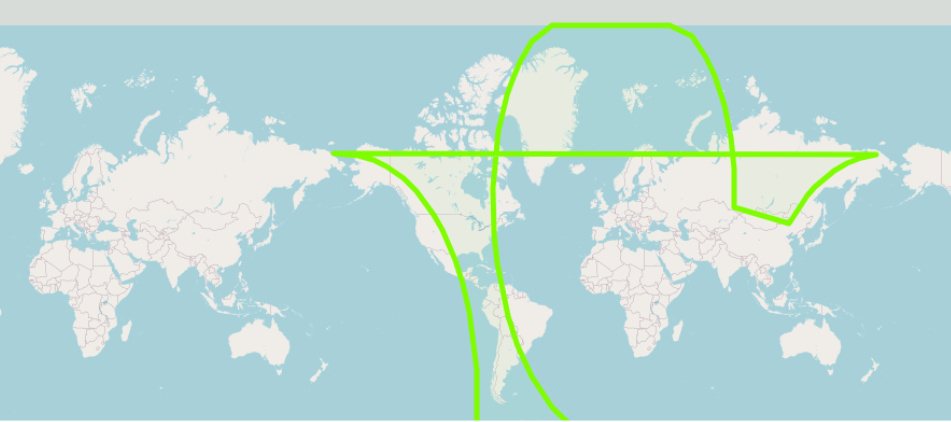
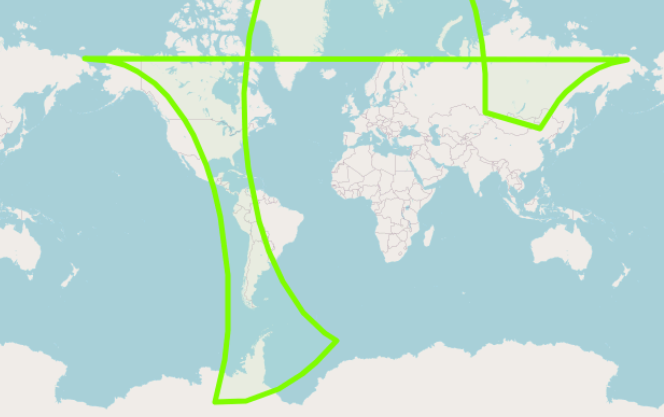
What can be wrong, as I am ploting the coordinates that come straight from the metadata? What am I missing?
 Thanks for the code example