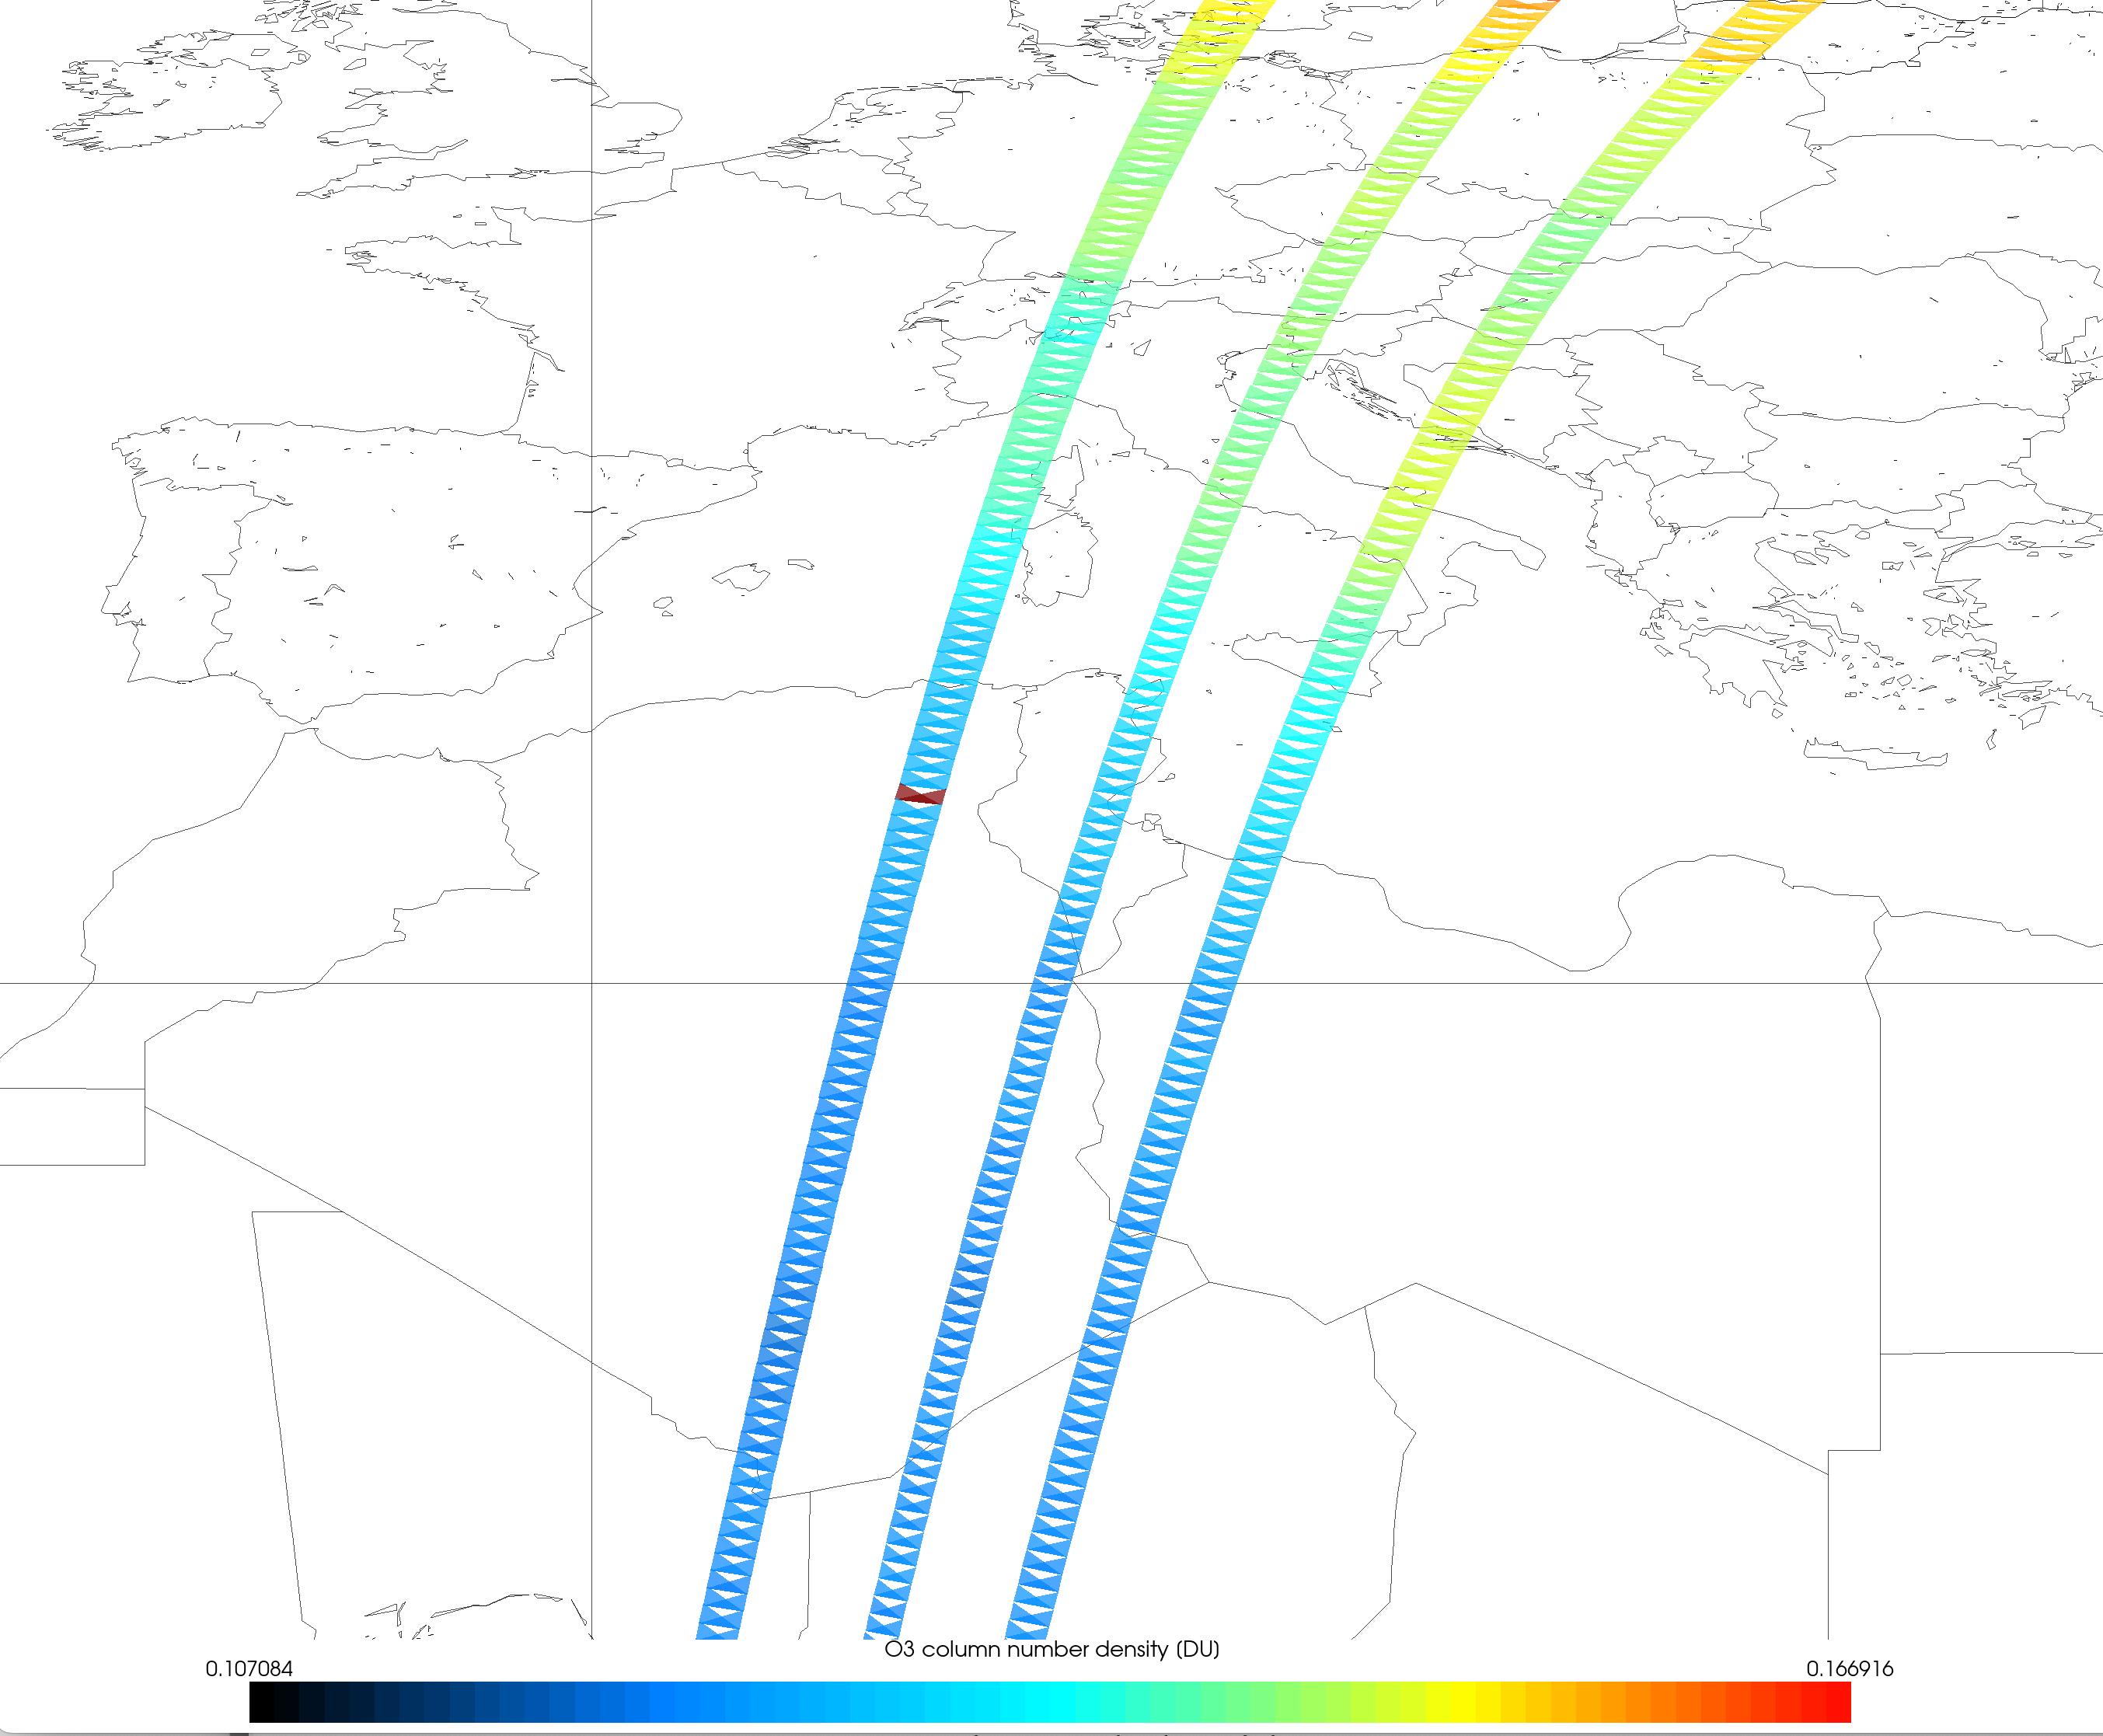
I tried to grid GOME_1 (resolution 320km) data to 1°x° grid. The data were reprocessed with GODFIT and the import_product works well.
When I grid the data, I would expect that ~3 grid cells have the same value. However, only one of the three grid cells is filled. Depending on whether I use keep latitude_bounds or not it is either the western pixel or the central one but not all three.
Klaus-Peter
I tried to dig into this, but there seem to be multiple issues here. Also, the HARP implementation is from more than 10 years ago, so it is tricky to find the historic design decisions on this.
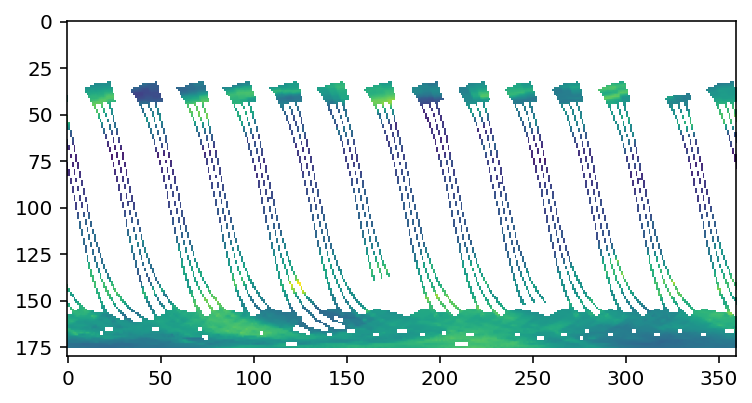
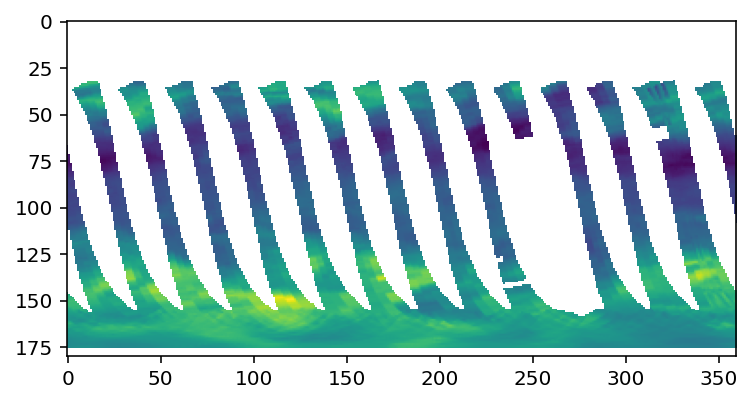
If I plot the L2 itself, I get the same small footprints as you see. So the problem seems to be in the L2 product itself:
However, there is another issue where the HARP ingestion does not seem to map the coordinates to a proper bounding polygon (the final polygon in HARP should order the corner points in counter-clockwise order). The data in the product seems to order the corners differently, resulting in the wedge-shaped polygons. We already had such a reordering in the HARP ingestion for the L2 NP product, but not (yet?) for the the L2 TC product. Note that this ordering of points does not impact the overall bounding box size of the area, so the small size is really a product problem.
Then, trying to look up the format specification, the L2 TC does not seem to be part of the current O3 CCI baseline. In the documents on Ozone ECV Project the Phase 2 PSD does not mention a L2 TC and the Phase 3 PSD is not available.
Also, the document does not mention at all, for the products that do have these lat/lon boundary variables, how the pixel coordinates are supposed to be ordered.
I would recommend to contact the Ozone CCI project and ask them to clarify these issues (i.e. small footprints in L2 product, lack of documentation for L2 TC, and lack of documentation of corner coordinate point ordering).
Be aware that the pixel coordinate ordering is likely still incorrect, so the weight attribution of each GOME pixel to each grid cell is likely not valid.
Hi, I don’t have experience with GOME-1, but recently dealt with a similar issue for GOME-2 data, where the pixel corner coordinates did not appear in the order that HARP (or CF conventions) would like.
At least for GOME-2, pixel corners are labeled ABCD, but this is not a “counterclockwise as seen from above order” as per usual convention, rather it looks like
Which is aligned with the C/D swap we are already doing for the L2 NP product (see above) to make it counter clockwise.
We will adjust HARP to do this for L2 TC as well.
But it would be good if the CCI project actually documented this properly.