Map Sentinel 5p CH4, SO2 and CO Data (Visan)

Hi, with Sander’s help I was able to map the global average concentration of NO2 for the month of october. I downloaded 15 files from the Sentinel 5p, for each day, and then I processed them into a daily average file using the NO2 code provided below. Then I averaged the daily averages to make a monthly average. I would now like to do the same for CH4, SO2 and CO. I tried to just edit the below code and replace any NO2s with CH4 or the gas I’m trying to measure. This doesn’t work. If somebody could tell me the code required for these three gases that would be great. Also keep in mind that I will be exporting these monthly average maps to qgis or panoply where I can design the aesthetics of the map to look nice, so the code needs to fit the format to be exported. I really appreciate Sander’s work so far, and hopefully by posting this question on the forum I can help others.

NO2 CODE:
product = harp.import_product(r"/Users/jpoetzscher/Downloads/NO2 OCT 1/*.nc", operations=‘tropospheric_NO2_column_number_density_validity>75;keep(latitude_bounds,longitude_bounds,tropospheric_NO2_column_number_density);bin_spatial(1801,-90,0.1,3601,-180,0.1);derive(tropospheric_NO2_column_number_density [Pmolec/cm2])’, post_operations=“bin();squash(time, (latitude_bounds,longitude_bounds));derive(latitude {latitude});derive(longitude {longitude});exclude(latitude_bounds,longitude_bounds,latitude_bounds_weight,longitude_bounds_weight,count,weight)”)
1 Like

Ok so I figured most of these out. I’d still appreciate if Sander could go over this to make sure I’m following conventions etc but I used the print tool for products and found the variables for CH4 and this is the code I wrote (pasted at bottom) I use a validity > 75 (is that good?) and since this is methane, I use ppbv which seems to be the convention for methane tracking. For SO2 and CO I wrote code that prints but I wasn’t sure about the units or colorrange so I’d like to see how Sander would write it in addition to his code for CH4. Thanks.

CH4 CODE
product = harp.import_product(r"/Users/jpoetzscher/Downloads/CH4 OCT 1/*.nc", operations=‘CH4_column_volume_mixing_ratio_dry_air_validity>75;keep(latitude_bounds,longitude_bounds,CH4_column_volume_mixing_ratio_dry_air);bin_spatial(1801,-90,0.1,3601,-180,0.1);’, post_operations=“bin();squash(time, (latitude_bounds,longitude_bounds));derive(latitude {latitude});derive(longitude {longitude});exclude(latitude_bounds,longitude_bounds,latitude_bounds_weight,longitude_bounds_weight,count,weight)”)
2 Likes

The validity filter values can be found in the Product Readme Files (PRFs) on the ESA website. These documents are good to read anyway, because they provide information on how good the data is according to the processor developers and validation teams.

The values to be used in the HARP filtering are the values mentioned for the qa_value, but then multiplied by 100 (which is how the qa_values are actually stored in the netCDF file if you don’t apply the scale factor).

For CH4, SO2, and CO the filter is >50.

Regarding the units to use for plots and the color tables to use, this is a bit up to yourself.
You can look at what the validation teams are doing in their quarterly ROCVR reports and routine plots for inspiration.

3 Likes

Thanks for the response, I found that the unit used for SO2 is DU how do I derive this in code?

This is my base SO2 code:
product = harp.import_product(r"/Users/jpoetzscher/Downloads/SO2 OCT 1/*.nc", operations=‘SO2_column_number_density_validity>50;keep(latitude_bounds,longitude_bounds,SO2_column_number_density);bin_spatial(1801,-90,0.1,3601,-180,0.1);derive(SO2_column_number_density [DU])’, post_operations=“bin();squash(time, (latitude_bounds,longitude_bounds));derive(latitude {latitude});derive(longitude {longitude});exclude(latitude_bounds,longitude_bounds,latitude_bounds_weight,longitude_bounds_weight,count,weight)”)
Also when I try to convert from the base unit of CO (mol/m2) to ppbv I get an error: CLibraryError: unit ‘mol/m^2’ cannot be converted to unit ‘ppbv’ (in unit conversion of variable ‘CO_column_number_density’)

The code I use for CO is:
product = harp.import_product(r"/Users/jpoetzscher/Downloads/CO OCT 1/*.nc", operations=‘CO_column_number_density_validity>50;keep(latitude_bounds,longitude_bounds,CO_column_number_density);bin_spatial(1801,-90,0.1,3601,-180,0.1);derive(CO_column_number_density [ppbv])’, post_operations=“bin();squash(time, (latitude_bounds,longitude_bounds));derive(latitude {latitude});derive(longitude {longitude});exclude(latitude_bounds,longitude_bounds,latitude_bounds_weight,longitude_bounds_weight,count,weight)”)

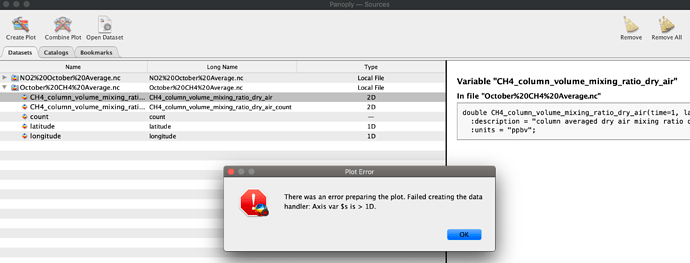
Also, I’ve completed my monthly averages for NO2 and CH4 but i wanted to export them to Panoply where there is more map customizability and I get an issue when I try to plot either one:
"There was an error preparing the plot. Failed creating the data handler: Axis var $s is > 1.
I can plot the daily averages just fine but, when in Visan I run the command:
average = harp.import_product("/Users/jpoetzscher/Downloads/October CH4/*.nc", post_operations=“bin()”)
and then export this file, which is now the monthly average, to downloads with the following command:
harp.export_product(average, “/Users/jpoetzscher/Downloads/October CH4 Average.nc”)
and then import this monthly average file into panoply I get this error.

1 Like

For CO the ‘column number density’ is in mol/m2. The unit ppbv (parts-per-billion) is for a mixing ratio, which is a different of type quantity. I assume you are looking for the xCO quantity, which is the volume mixing ratio of the whole column. You can have this quantity calculated by HARP using derive(CO_column_volume_mixing_ratio {time} [ppbv]).

For panoply, you will need axis variables that are independent of the time axis.
Whenever you perform a bin() operation, HARP will introduce a time axis to all variables that it concatenates. For the variables where you have the same content in each product, you can remove this time axis again using the squash() operation. You already did this when you created your daily files. So, instead of using post_operations="bin()", use post_operations="bin();squash(time, (latitude,longitude))".

3 Likes

Your advice for making my monthly averages work in Panoply was great! I’ve finally completed my maps for methane and NO2. With CO and SO2 however, I’m still encountering difficulties. Since DU (Dobson Units) is the typial unit used for SO2 and ppbv is the typical unit used for CO, I looked into the difference between mixing ratios and column densities. I found that DU is a unit that measures column number density whereas ppbv, as you said, is a unit for mixing ratio. In Harp/Visan, both SO2 and CO (SO2_column_number_density and CO_column_number_density) come with the unit mol/m^2, a column density. I presume therefore that for SO2 it should be simple to derive DU given that they are the same type of unit but in your previous response you didn’t provide code for this.
Again I attempted to run this code but it didn’t work, if you could edit it so I can convert from the normal mol/m^2 unit to DU that would be great:
product = harp.import_product(r"/Users/jpoetzscher/Downloads/SO2 OCT 1/*.nc", operations=‘SO2_column_number_density_validity>50;keep(latitude_bounds,longitude_bounds,SO2_column_number_density);bin_spatial(1801,-90,0.1,3601,-180,0.1); derive(SO2_column_number_density [DU]) ’, post_operations=“bin();squash(time, (latitude_bounds,longitude_bounds));derive(latitude {latitude});derive(longitude {longitude});exclude(latitude_bounds,longitude_bounds,latitude_bounds_weight,longitude_bounds_weight,count,weight)”)
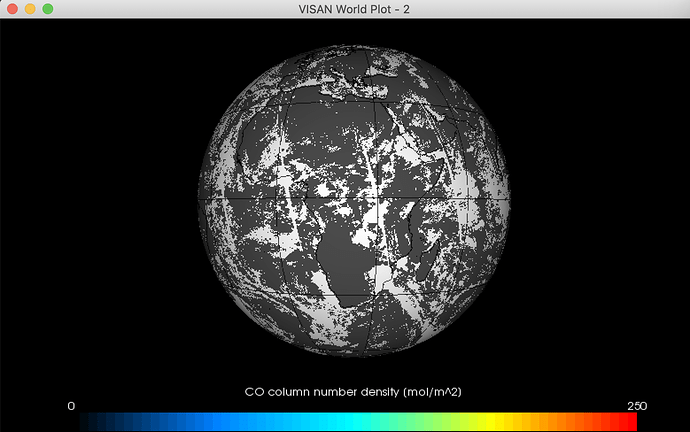
In terms of CO, I guess I need to translate from column number density to mixing ratio to go from mol/m^2 to ppbv. However, I integrated the line of code you provided in your previous response “derive(CO_column_volume_mixing_ratio {time} [ppbv])” and it didn’t work (Image below) I’d love to complete this today and I really appreciate your continuous help.

1 Like

The SO2 ingestion should work. What is the error that you are getting?

For CO, this doesn’t work since the keep() operation that is before the derivation throws out all the variables that are needed to derive the CO column vmr. To correct this we need to derive the xCO before the keep() operation, like:

product = harp.import_product(r"/Users/jpoetzscher/Downloads/CO OCT 1/*.nc",
    operations='CO_column_number_density_validity>50;derive(CO_column_volume_mixing_ratio {time} [ppbv]);keep(latitude_bounds,longitude_bounds,CO_column_volume_mixing_ratio);bin_spatial(1801,-90,0.1,3601,-180,0.1)',
    post_operations='bin();squash(time, (latitude_bounds,longitude_bounds));derive(latitude {latitude});derive(longitude {longitude});exclude(latitude_bounds,longitude_bounds,latitude_bounds_weight,longitude_bounds_weight,count,weight)')
1 Like

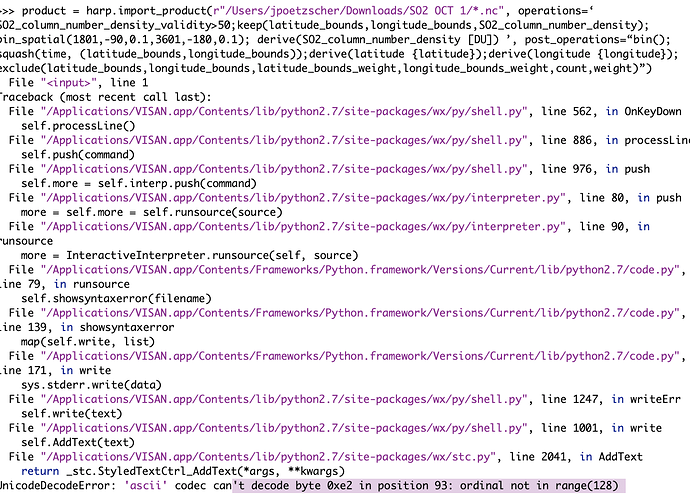
I think something just broke on my visan. When ever I try to input anything this happens

1 Like

Make sure to replace all ‘fancy’ quotes by regular quote characters.

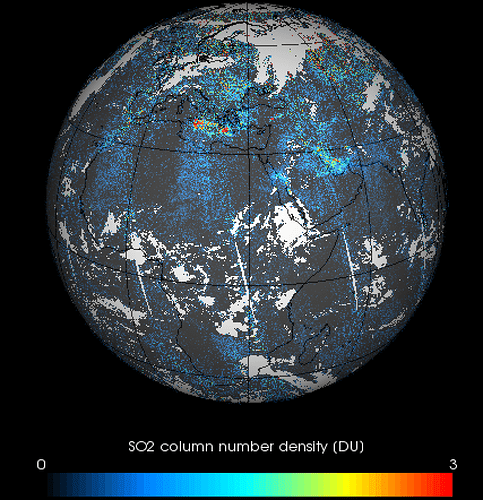
yep that worked. So I must have messed something up with SO2 prior, because I ran it again and it worked. It looks a bit weird though with the underlying charcoal coloring. What is that? This is just for one day though so perhaps when I do the monthly average the grey will be hidden as there will be more colored pixels?

In terms of CO, the code ran error free but then when I go to plot it, it is in the form of mol/m^2

1 Like

I think I know what went wrong for the SO2 binning. You probably got the following error message

ERROR: variables don't have the same number of dimensions (SO2_column_number_density_weight)

This is a bug in HARP that I just fixed. You can work around it for the moment by removing the SO2_column_number_density_weight variable before binning (this will create slightly different values for the daily/monthly averages, but this should not be significant):

product = harp.import_product(r"/Users/jpoetzscher/Downloads/SO2 OCT 1/*.nc",
    operations='SO2_column_number_density_validity>50;keep(latitude_bounds,longitude_bounds,SO2_column_number_density);bin_spatial(1801,-90,0.1,3601,-180,0.1);derive(SO2_column_number_density [DU]);exclude(SO2_column_number_density_weight)',
    post_operations='bin();squash(time, (latitude_bounds,longitude_bounds));derive(latitude {latitude});derive(longitude {longitude});exclude(latitude_bounds,longitude_bounds,latitude_bounds_weight,longitude_bounds_weight,count,weight)')
1 Like

For the CO plot, you need to make sure to change CO_column_number_density to CO_column_volume_mixing_ratio in the keep() operation. Otherwise you just throw away the CO column vmr again :wink:

1 Like

Thanks! The CO worked!

The SO2 didn’t change it still has the grey background stuff but I’m confused, is that bad? I assumed thats just what the data looks like.

I am not sure what you mean with ‘grey background’. Do you mean the white spots? Those are locations where it wasn’t possible to calculate good SO2 values (due to our filtering on the quality flag). This could be because of clouds or other reasons. Having those gaps in a daily plot is quite normal.

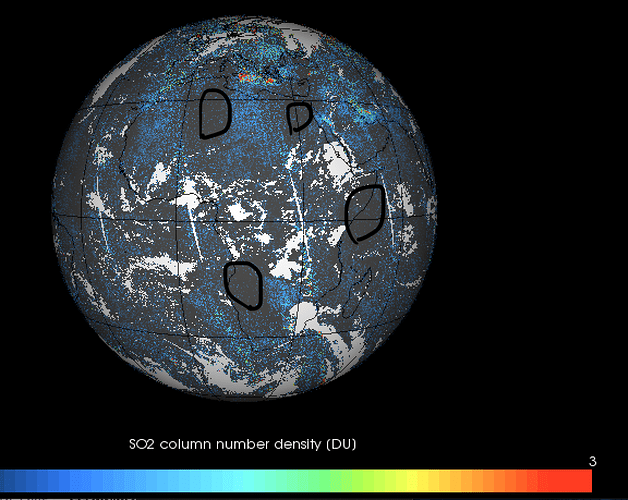
No its difficult to explain so I just annotated the image and cicled the grey spots I’m referring to. It’s probably normal and I assume this is what the data should look like but I just want to make sure. If it is ok then we’ve basically worked through all the issues and so I want to thank you again.

Ah. Those black areas. This is also due to the color range clipping. If you would use a colorrange of e.g. [-3,3] you would also see values below 0.

These negative values are due to the high noise level. When you average over a longer time period this noise level should decrease. Another way to decrease the noise level is to use a coarser spatial grid.

I tried the NO2 code and found the single quotation marks-- ’ – should be changed to double quotation marks, then it can be run at VISAN.

Can this be done for NO2? I’m using following code:

harp.import_product(paths_2[i],
operations=“tropospheric_NO2_column_volume_mixing_ratio_validity>75;keep(latitude_bounds,longitude_bounds**,tropospheric_NO2_column_volume_mixing_ratio**);bin_spatial(7,35.7,0.1,7,14.1,0.1);derive(tropospheric_NO2_column_volume_mixing_ratio [ppbv])”,
post_operations= “bin();squash(time, (latitude_bounds,longitude_bounds));derive(latitude {latitude});derive(longitude {longitude});exclude(latitude_bounds,longitude_bounds,latitude_bounds_weight,longitude_bounds_weight,count,weight)”))

and getting the error: cannot filter on non-existent variable tropospheric_NO2_column_volume_mixing_ratio_validity

Thanks!

1 Like

Can this be done for NO2?

Why do you want the tropospheric NO2 in volume mixing ratios? This is not the natural quantity for NO2. It is also not what is in the product.
The way to handle NO2 is already shown in the first post of this topic.

Yes I was working fine with “tropospheric_NO2_column_number_density” but now I wish to correlate S5-P data with ground-base NO2 dataset in ppb. So this is not possible with the NO2 product?