Hello,
I’m working with Sentinel-5P data for the first time. Averaging Level 3 products at 0.05 degree resolution processed with HARP (qa > 0.5) for July 2021 I get below map.
It’s very noisy and I’m unsure about the high SO2 values which seem to be linked to sea ice?
Is this generally what to expect or am I missing out on some more filtering / postprocessing which is typically done.
The image is also based on > 300 individual Level 2 files so I’m surprised about the orbit artefacts still in there.
I’m also temporally averaging the images in Python after using HARP. If I would do this using HARP as well, would the averaging take into account the uncertainty of the individual orbits or have any other advantages over my current approach?
Welcome to the joy of sensing SO2 from space!  it is not easy, as you have found out.
Even thought I guess you have already looked into these documents, I would suggest that you go through the Readme File, S5P-MPC-BIRA-PRF-SO2_v2.04.01_2.4_20220720 (copernicus.eu)
and also the quarterly validation report, S5P-MPC-IASB-ROCVR-15.01.00_20220713_signed.pdf (tropomi.eu)
Even though the recommendation is to use qa> 50, I would recommend that you switch to qa==100, to make sure that you clean your results up a bit. Further more, it might be a nice idea to add more restrictions than the qa suggests for e.g. cloud_fraction_crb < 0.2, or you might choose to disregard the edges of the swath, for e.g. pixels 0-20 and from 430-450.
It all depends on what you want to use your results for. Different scientific goals require different filtering procedures.
Do let me know if I can be of further assistance,
Best wishes,
MariLiza
Hello, thank you. This was very helpful!
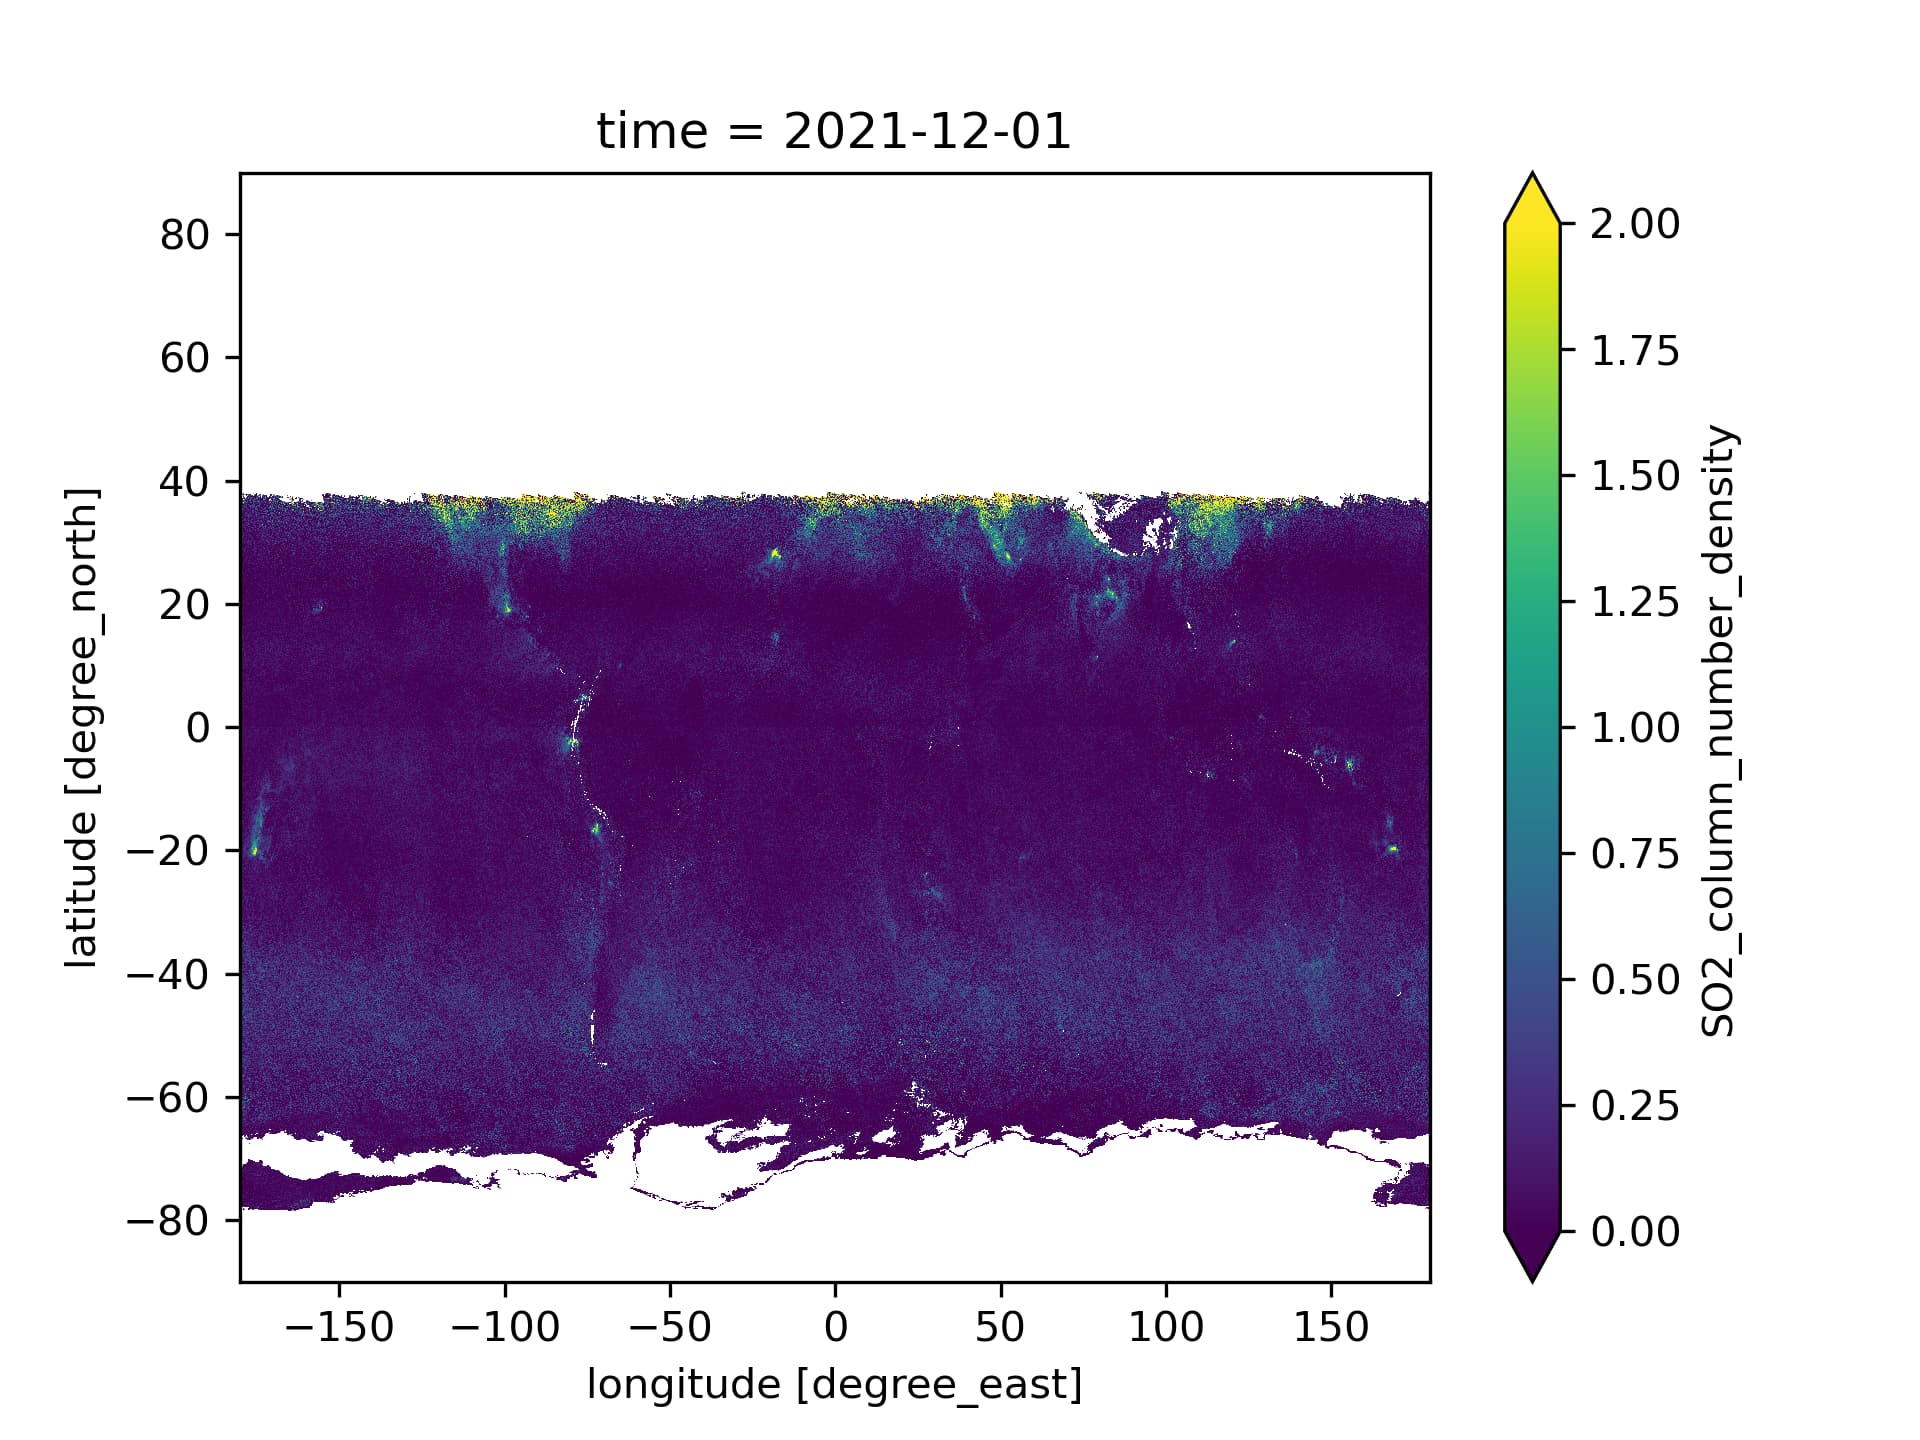
When using a high qa cutoff value I loose large amounts of the Northern hemisphere (see figure showing the monthly average for November 2021). Is this something to be expected?
With the recommended qa 0.5 value the noise is however huge and the data gets unusable. I wonder what the reason for these artefacts is. I’d be happy to play around with additional quality flags. How would we for instance exclude the edges of the swath with the HARP operations?
Basically I’d like as clean monthly maps as possible to combine them with other datasets and attempt to mimic ground truth data.
I have found some interesting papers, although using S5P NO2 data.
Hey there woozle341,
For your questions:
- Yes, the image you show me is to be expected. The high qa cutoff excludes more SZA values, hence the reason why the winter-time NH is missing.
- You can ingest the parameter scan_subindex and use the HARP operations to exclude parts of the scan, if you want to do it in one go.
- I do not wish to bust your bubble but what you are describing works for NO2 in some cases, but I seriously doubt it will work for SO2, unless you will look directly over strong point sources. Satellite SO2 is very difficult to manage, and for daily temporal resolution you would really need a strong source to translate the VCD into surface concentration.
Having said all that, best of luck!
MariLiza
1 Like