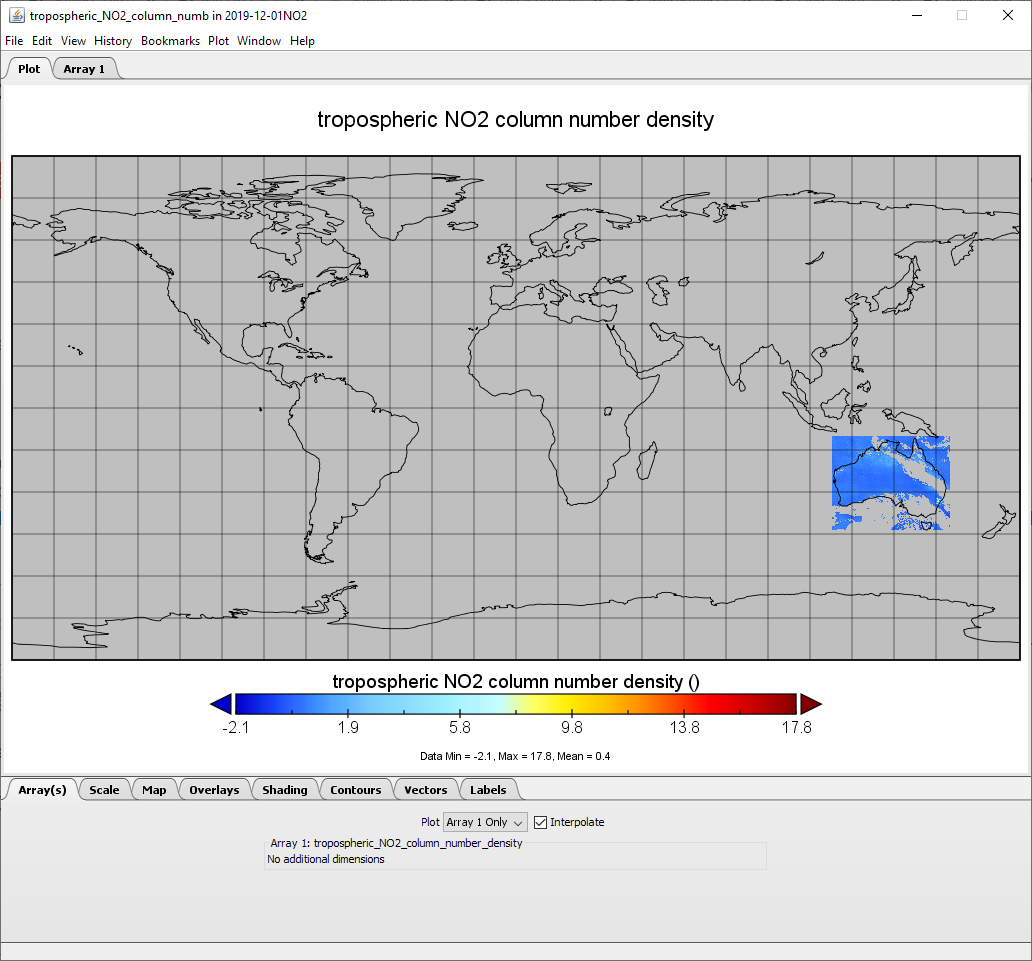
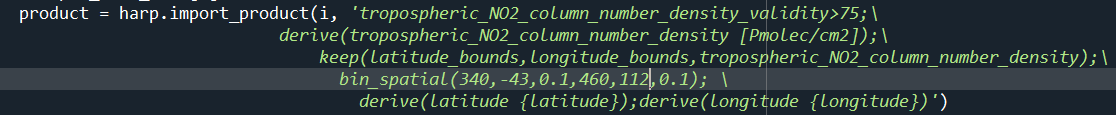
Hi, sir, I’m using harp in python to regrid NO2 data, here is the code
from Panoply figure, there are some negative NO2 value, my question is why is it negative, should I set all negative as 0 ? Thank you in advance.
Hi, sir, I’m using harp in python to regrid NO2 data, here is the code
from Panoply figure, there are some negative NO2 value, my question is why is it negative, should I set all negative as 0 ? Thank you in advance.
Negative values can be expected when you have low values and a high error. You can look at the tropospheric_NO2_column_number_density_uncertainty for the estimated error. Since the error is random, it can happend that values end up below 0.
When you are just visualising the data, you can just omit the negative values (or start your colorrange at 0).
However, when you are averaging the data (e.g. input to a bin_spatial() or bin() operation) you should not discard these negative values, because you would be introducing a positive bias in the averaged value if you would do so.