Plotting NO2 data using Visan

Hi everyone!

I’m completely new to HARP, Visan and all this stuff, so I have a question. I’m trying to reproduce this: https://www.unigis.es/wp-content/uploads/2020/10/GeoPython-Atmospheric-Toolbox-COVID19.pdf
So I’m trying to plot NO2. My code looks like this:

product = harp.import_product(my_nc_file, operations="tropospheric_NO2_column_number_density_validity > 50;")

wplot(product)

This is my simple polygon:

{
  "type": "FeatureCollection",
  "features": [
    {
      "type": "Feature",
      "properties": {},
      "geometry": {
        "type": "Polygon",
        "coordinates": [
          [
            [
              27.0703125,
              48.25394114463431
            ],
            [
              50.0537109375,
              48.25394114463431
            ],
            [
              50.0537109375,
              60.60854176060904
            ],
            [
              27.0703125,
              60.60854176060904
            ],
            [
              27.0703125,
              48.25394114463431
            ]
          ]
        ]
      }
    }
  ]
}

And i’m getting this:

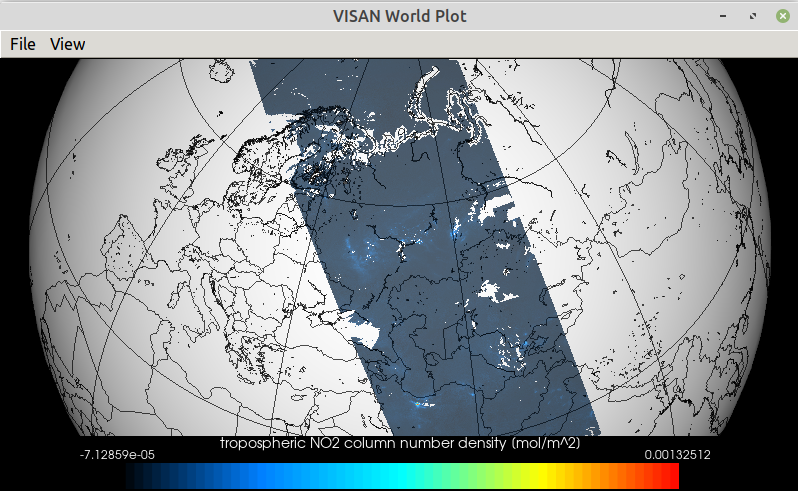
Is it possible to do it somehow meaningful?

Thank you for your help and time!

It doesn’t seem like you are following the steps that are mentioned in the presentation that you linked. I would recommend you at least try that first.

If you then still have questions, please try to ask a more specific question, because I have a hard time understanding what you mean with ‘somehow meaningful’.

Thanks. In the presentation the considering area is Spain. I need Moscow, so I have another .nc files. I tried to run import_product with multiple params (various params in operations, post operations), but things getting worse.

By “meaningful” I mean that the bottom bar has colors from blue to red, but it’s all blue in my plot.