[Use Case #3] Merging NO2 data creates visual overlap when plotted

Hello,

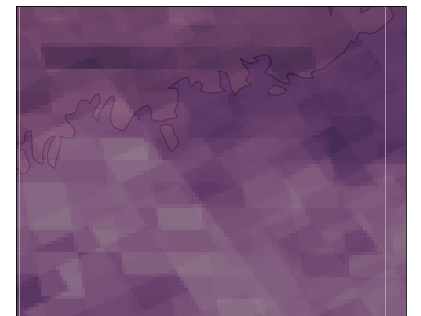
I’m trying to plot the time-averaged total column amounts of NO2 over the Eastern Seaboard and I keep encountering the following issue when I plot the data:
conflicting_gridlines

It may be difficult to see, but it appears as though there is seemingly multiple gridboxes overlapping each other, and are not actually merged/averaged into a single gridbox.

Here is my harp import code, there should be only three TROPOMI NO2 files being imported in this example, which will only cover the dates 2018-04-30 to 2018-05-01 (2 days).

I’ve also included the “reduce_operations” argument as well, choosing to merge the files over the time variable (hopefully taking the temporal average).

#### TEST ####
operations = ";".join([
    "tropospheric_NO2_column_number_density_validity>0",
    "keep(latitude_bounds,longitude_bounds,datetime_start,datetime_length,tropospheric_NO2_column_number_density)",
    "derive(datetime_start {time} [days since 2000-01-01])",
    "derive(datetime_stop {time}[days since 2000-01-01])", 
    "exclude(datetime_length)",
    "bin_spatial(800, 40, 0.01, 400, -70, 0.01)",
    "derive(tropospheric_NO2_column_number_density [Pmolec/cm2])",
    "derive(latitude {latitude})",
    "derive(longitude {longitude})"
    ])
reduce_operations = ";".join([
    "squash(time, (latitude, longitude, latitude_bounds, longitude_bounds))",
    "bin()"
])

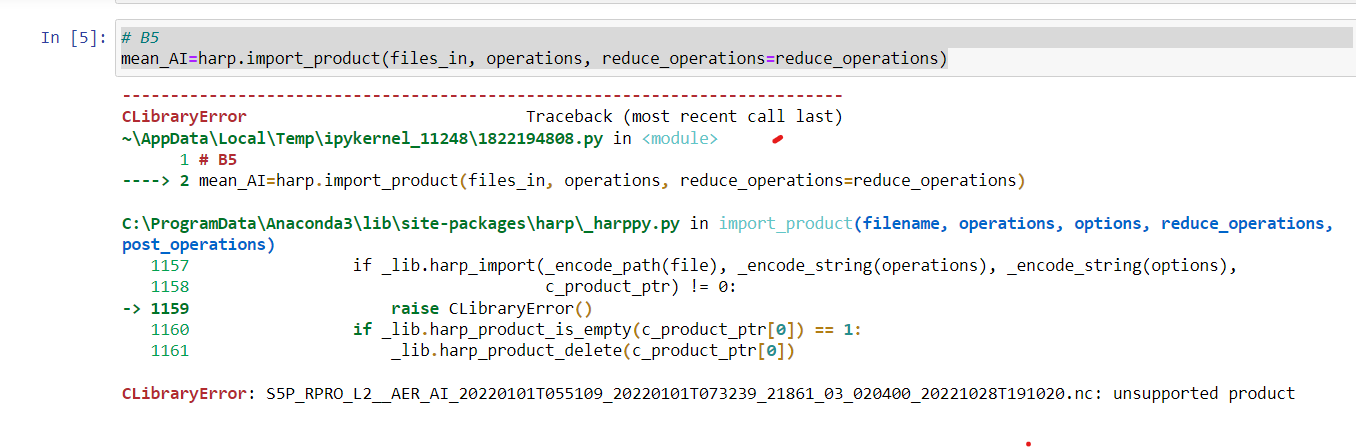
harp_L2_L3 = harp.import_product(NO2_files[:3], operations = operations,
                reduce_operations = reduce_operations)

                                     
export_folder = "{export_path}/{name}".format(export_path=export_path, name=i.split('/')[-1].replace('L2', 'L3')) 
harp.export_product(harp_L2_L3, export_folder, file_format='netcdf')

I then plot it using a similar code to that used in “Use case #3”:

NO2_val = harp_L2_L3['tropospheric_NO2_column_number_density'].data
gridlat_NO2 = np.append(harp_L2_L3.latitude_bounds.data[:,0], harp_L2_L3.latitude_bounds.data[-1,1])
gridlon_NO2 = np.append(harp_L2_L3.longitude_bounds.data[:,0], harp_L2_L3.longitude_bounds.data[-1,1])

fig = plt.figure(figsize=(20,20))
ax = plt.axes(projection=ccrs.PlateCarree())
#     ax.set_global()
ax.add_feature(cartopy.feature.RIVERS)
ax.add_feature(cartopy.feature.OCEAN)
ax.add_feature(cartopy.feature.LAND, edgecolor='black')
ax.coastlines('10m')
ax.gridlines()
# ax.stock_img()
colortable = cm.tokyo
# # NO2
img = plt.pcolormesh(gridlon_NO2, gridlat_NO2, NO2_val[0],
                         cmap=colortable, transform=ccrs.PlateCarree(), alpha=0.80)

cbar = fig.colorbar(img, ax=ax,orientation='horizontal', fraction=0.04, pad=0.1)

cbar.ax.tick_params(labelsize=14)
plt.show()

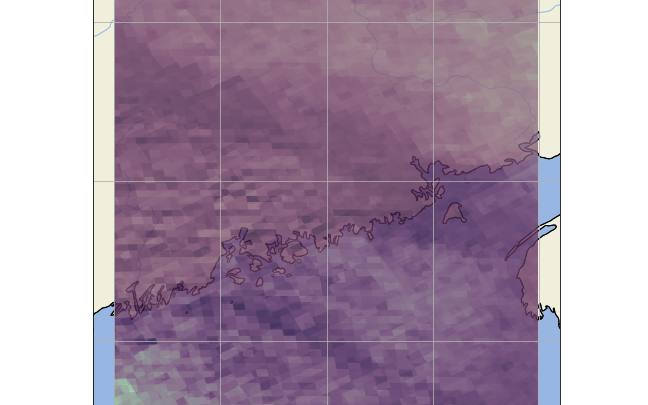
Which gives the aforementioned problem.

So sorry for the interruption, but I would be very grateful for any help or direction!

With a grid resolution of 0.01 degree you are oversampling the resolution of the instrument. So, the blocks you are seeing are the satellite pixels and since different overpasses have different pixel locations/orientations you will see the blurring artefacts that you are now seeing.

The ‘native’ resolution of the S5P NO2 data is about 0.02 degree resolution. So you will only get rid of this blurring effect if you go to a resolution that is lower than that. Try e.g. bin_spatial(200, 40, 0.04, 100, -70, 0.04) to see what I mean.

Wow! You’re entirely correct, my grids are perfectly uniform now.
Thank you very much for the quick fix!

I wanted to quickly ask a second question, does HARP have the functionality to oversample the data and also re-grid it into some “standard” gridbox that will try and fit all satellite pixels into it irrespective of their unique locations/orientations (so as to avoid the artefacts)?

In other words, can I create a sort of “model gridbox” that harp would try and both oversample and fit all the satellite data into?

Thank you again for all your help!

I am not sure I understand your question. What you ask for is exactly what you have been doing initially with your 0.01 degree grid setting.

Sorry!
A better question I should ask is when I over sample the satellite data, and then merge all the satellite paths together into a single daily file, do the grid box positions where two separate satellite paths overlap average their two pixels together, and not simply superimpose them on top of each other?

Here’s another zoomed in photo of what I mean:
overlapping_gridlines

In the photo you’ll see what appears as if two data sets are superimposed onto one another, and not actually merged together into their overlapping pixels. Is it possible to both oversample the data AND have any pixels where two unique satellite orbits overlap take the mean of the NO2 data of both orbits and then insert that averaged value into the merged grid box?

Averaging is superimposing. You are trying to make a distinction between something that is the same.

You’re entirely correct! I think I understand where I went wrong. Thank you for your time you’ve been a great help!

Is it okay to define new grid at 0.01 degree resolution for AAI data?

The AAI L2 product has the same resolution as NO2, so you should be able to use the same grid resolution as you have been using for NO2. Something like 0.01 or 0.02 should be sufficiently detailed.

1 Like


While with some of dates (eg. 01/01/2022) I am facing these error (error attached in the picture). Why is it throwing specifically with only few dates but not with other date?

I think there may be something wrong with the product. Perhaps something went wrong with the download. Please check that the file size is correct and that you haven’t got a partial download (or that the file size is 0).

1 Like