Hi everyone! I’m working with HARP in R, currently with SCIAMACHY CH4 data. I’m fairly new so it’s having a bit of a hard time fully understanding what I’m doing at HARP.
So far I have managed to obtain the CH4 data from the SCIAMACHY files (format .N1), apply a couple of quality filters and do the spatial binning in my area of interest (Argentina).
This is the code:
SCI_L3 = harp::import(file,
operations = ‘CH4_column_number_density_uncertainty > 0;
solar_zenith_angle < 80;
cloud_fraction < 0.2;
derive(CH4_column_number_density{time}[molec/m2]);
keep(latitude_bounds,longitude_bounds,
CH4_column_number_density);
bin_spatial(143,-58,0.3,45,-48,0.6)’,
‘dataset=nad_ir1_ch4’)
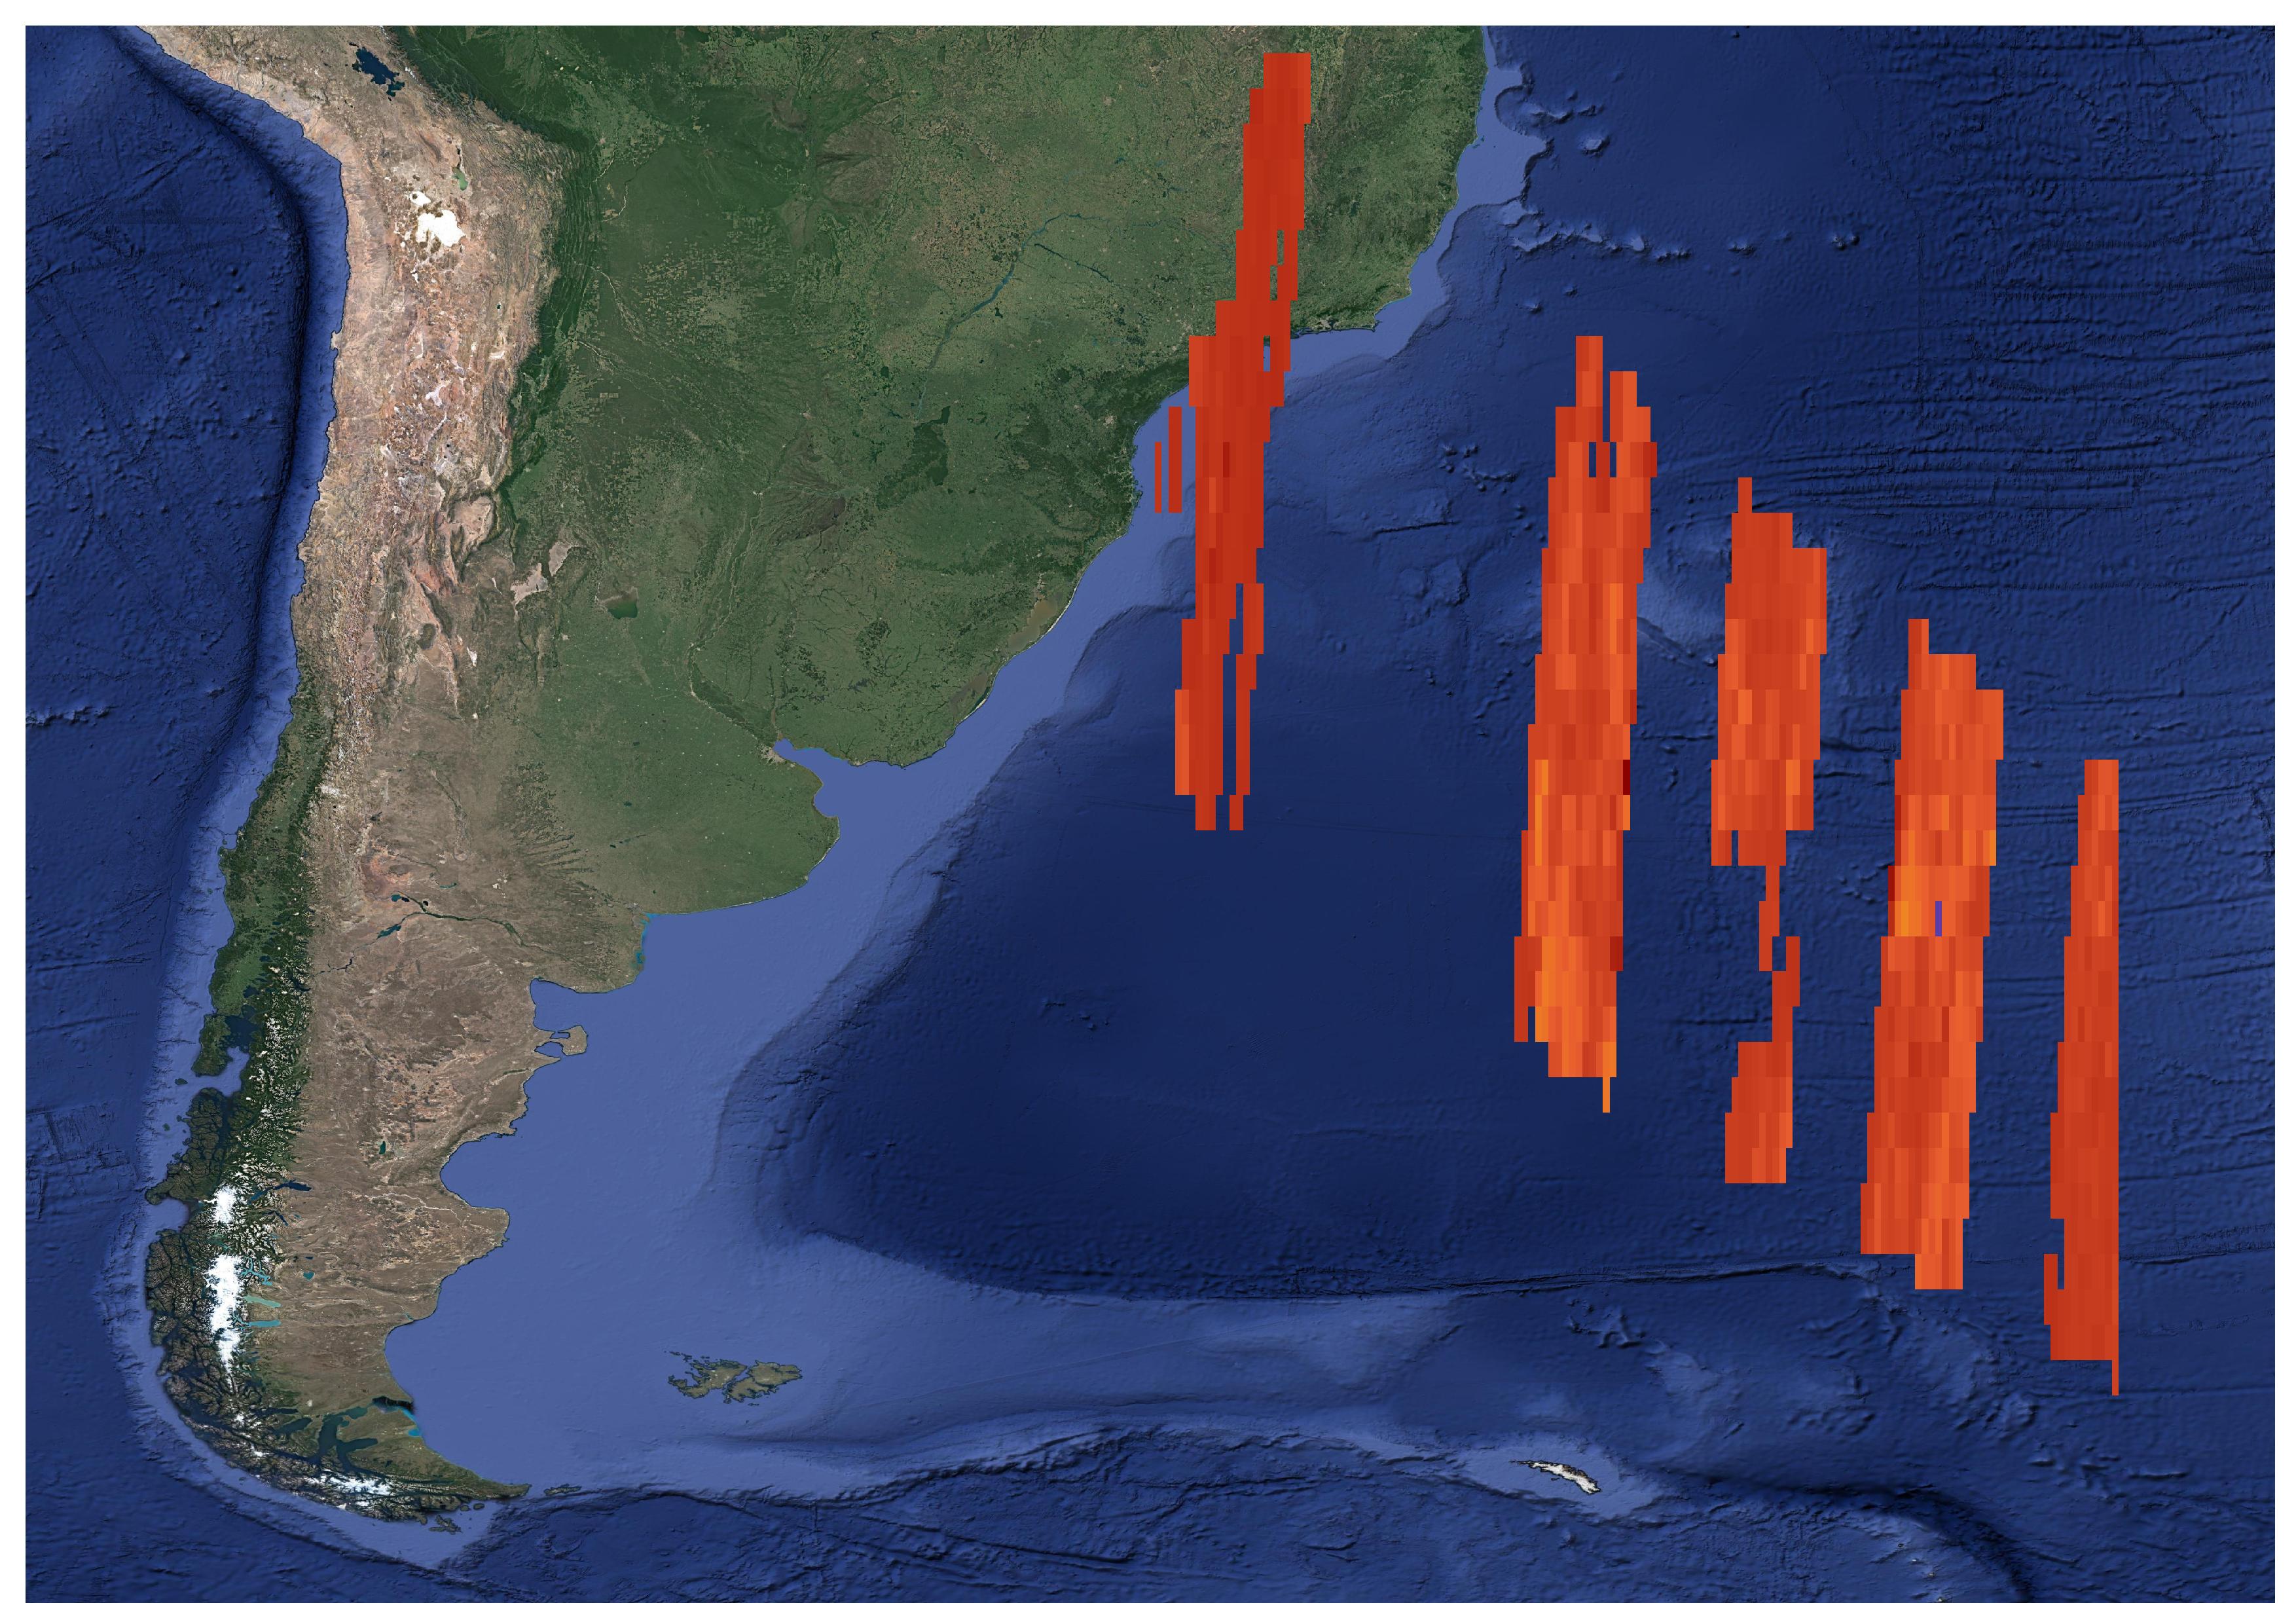
Then I add the CH4, latitude and longitude values into an array and convert it to raster (crs = WGS84). Everything seems fine, but when I visualize the plot in QGIS I get this:
Something tells me that the raster is rotated (maybe 90 ° AC?). I’m not quite sure I understand the arguments in bin_spatial (), does lat/lon_edge_offset represent the lower left corner of the grid?
I also don’t know why I have those gaps in the data…
I know this is a lot and not very specific, but any help you can give me would be great! Thank you
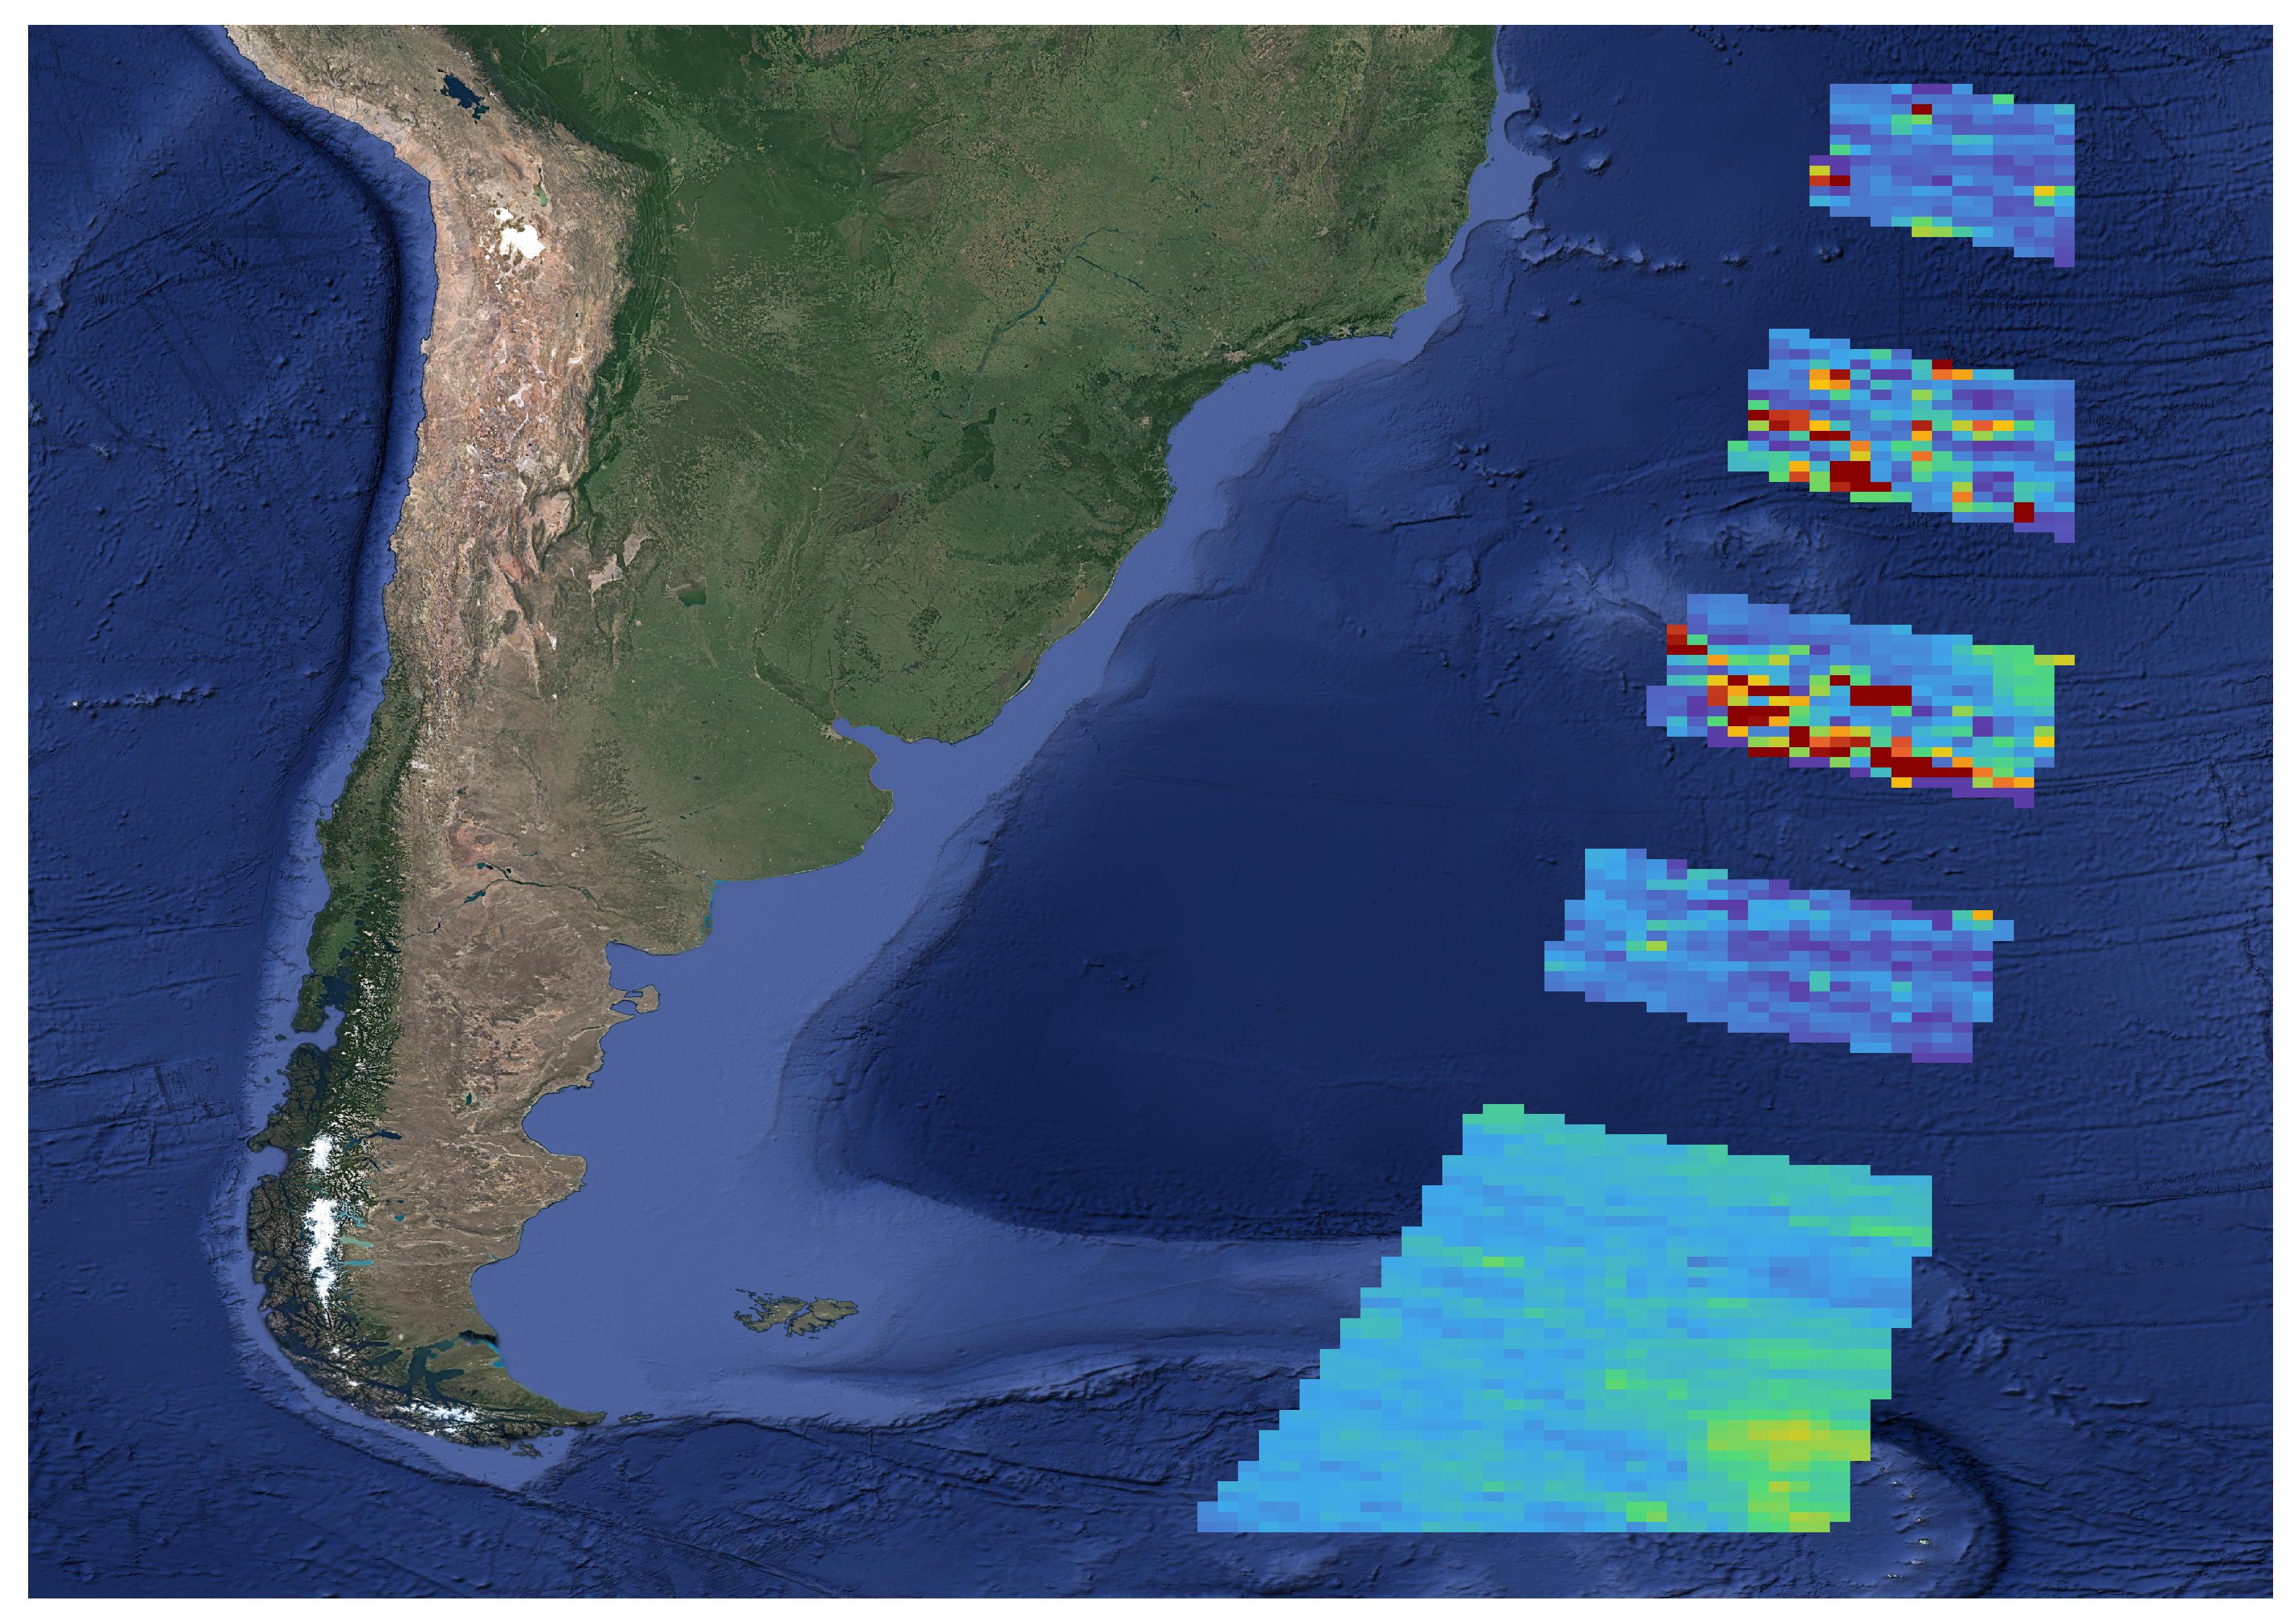
I think the gaps in the data are natural for SCIAMACHY, I assume the area is filled in by the monthly averages. I don’t know, maybe I’m missing something.
Now my problem is still that I am not getting the data from South America, but from the right side over the ocean. There is probably something in the bin_spatial() arguments that is not right.
Can you let me know which orbits you are processing? I might be able to check what is going on.
But be aware that SCIAMACHY does not cover the full globe in one day. It doesn’t have the high spatial resolution or the coverage that more recent missions such as OMI or Sentinel-5P have.
Hi Sander, thanks for your reply!
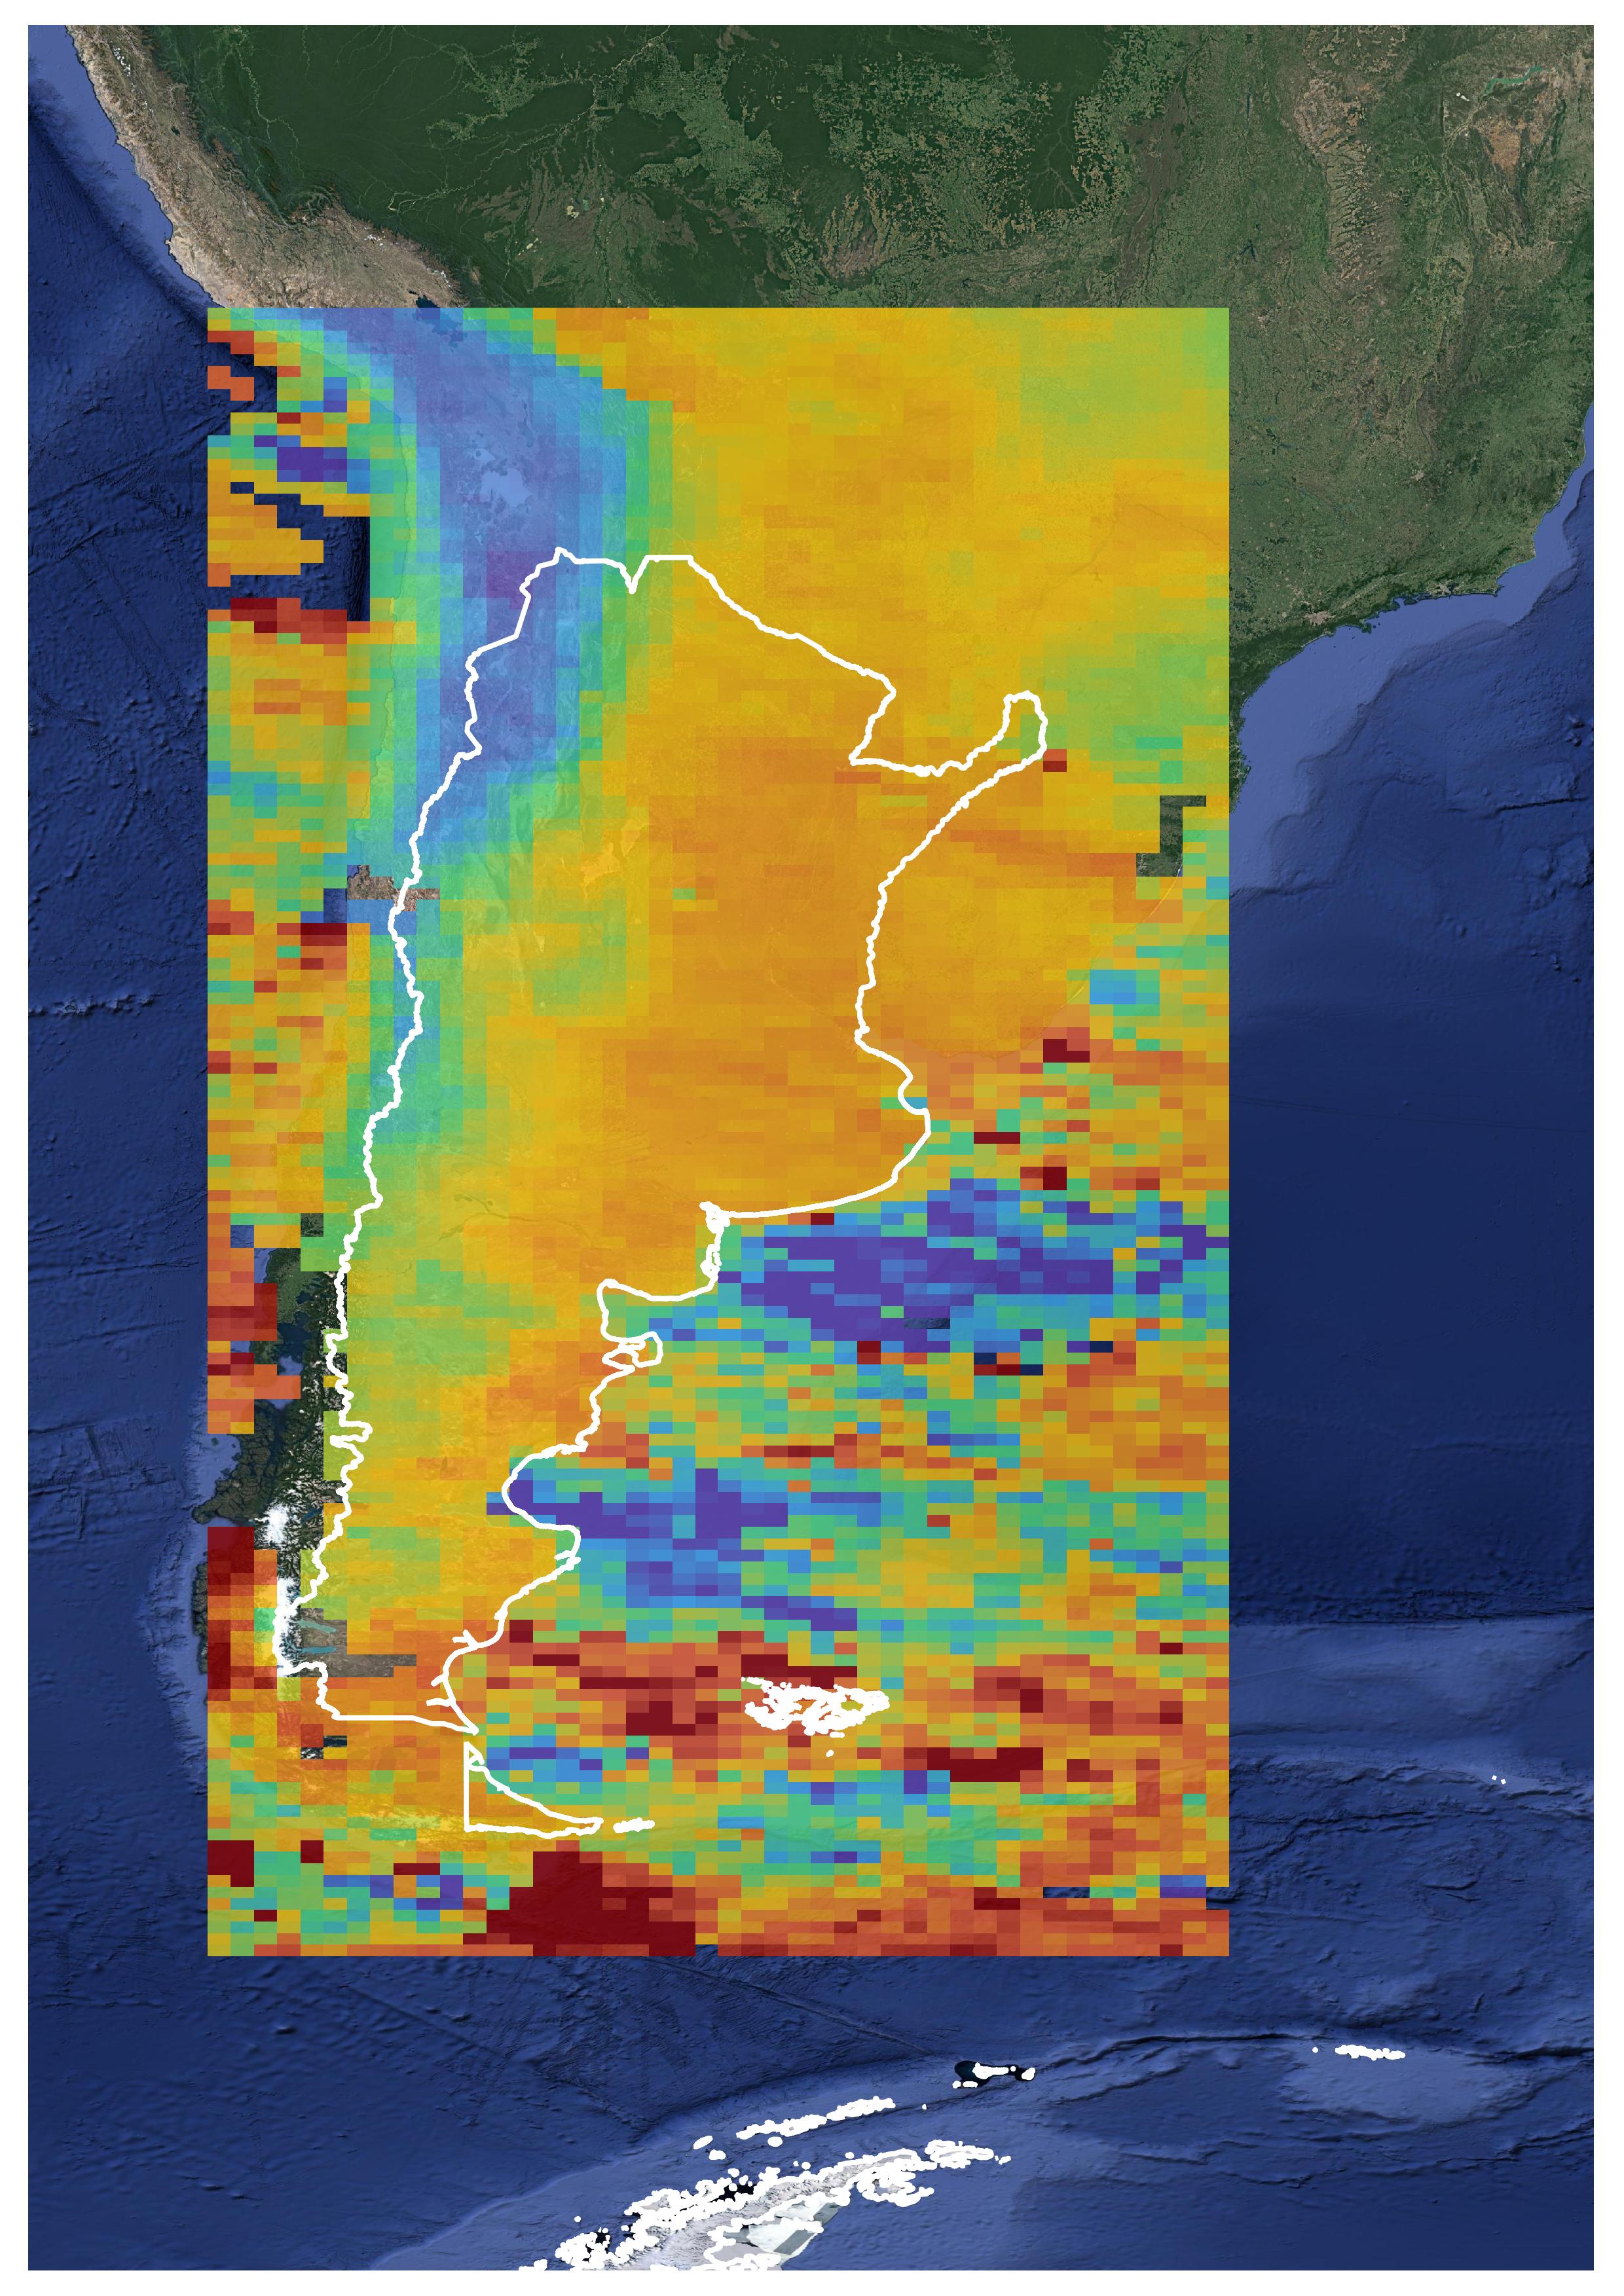
I was making a mistake with lon/lat_offset, I changed their values in bin_spatial () to (-75, -58) respectively and it works. This is what I get by averaging a month of data:
Looks good. Now I would like to apply all the recommended quality filters, however I don’t know if I can do them all from harp. These are the recommended filters:
Convergende reached (first bit of quality flag == True);
Solar zenith angle less than 80° (second bit of quality flag == True);
Only observations over land;
Only observations with cloud fraction less than 20% (from dataset “clouds_aerosol”);
Errors α(CH4), α(CO2), α(H2O) positive;
Error α(CO2) < 0.005;
Erros α(CH4) < 0.01
As seen in my code above, I have no problems with the solar zenith angle and the cloud fraction, these are variables present in the product. The species_column_number_density_uncertainty variable is described, in the harp documentation, as the error associated with the VCD. But when ingesting the methane dataset (in harp::import the option at the end, ‘dataset=nad_ir1_ch4’), I lose access to errors from other datasets like CO2 and H2O, so I don’t know how to apply those filters.
Another important issue is the filtering of pixels over the oceans. In github I found these: land/sea mask, but I don’t know how to apply it or even if it is possible with the SCIAMACHY data.
For the quality flag. There is a quality_flag in the product, but this is only 0 or 1.
There is a flag_vcd_flags, which is ingested by HARP as CH4_column_number_density_validity, but I am not sure which bits are the first and second bits (do they start counting at the most significant bit or the least significant bit)? You can filter on this flag using bitfield masks. If it is the least significant bits you would use CH4_column_number_density_validity&=3.
For the errors. What is α? Do you know which fields in the product these would be?
Be aware that CO2 is not available in the 6.01 dataset, so I am not sure which field they are talking about.
And H2O is retrieved at a different spatial resolution than CH4, so I don’t know how you would combine that.
For the land mapping, I don’t think this information is available in the product itself. But I see that you are already able to outline your area-of-interest in your picture. So perhaps you can perform some post-processing on the gridded data itself to only keep the data within that area?
Also be aware that SCIAMACHY has both forward and backward scan measurements. I am not sure if you want to mix them. You might have to select e.g. only forwards scan pixels by using the scan_direction_type=="forward" HARP filter.
Hi Sander, thank you very much for your answer, it helped me a lot.
I’ve been doing a bit of research and found the following:
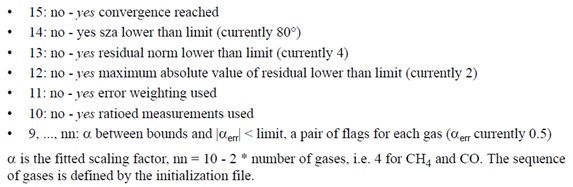
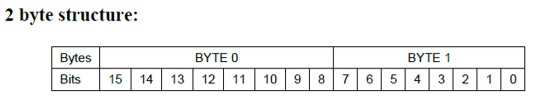
The flag_vcd_flags is what I need. When I inspect the files from VISAN I find this field inside the CH4 dataset, it contains a number (for example: 59376 or 9872), which I assume HARP reads directly in binary to make the filter. It is a 16-bit structure, from 0 to 15, as follows:
I’m only interested in the first and second bits, and the α errors (I got the criteria for filtering from the Product Quality README File for 6.01 dataset). The α errors are in the non_linear_fit_param_err field within the product, this has 6 entries for CH4, and the first three correspond to the α of CH4, CO2 and H2O respectively. The last three entries are empty (i.e. filled with 0). But I don’t know if this field is ingested by HARP (I don’t see it in the documentation). Somehow this information should be in the quality flags field, from bit 9 to nn, but I really don’t know how to apply that.
Regarding the order I found this: The flags describing ther VCD calculation have to be interpreted bit-wise. The bit numbering convention is defined in document ANNEX A, and says: Byte 0 is the most significant byte. It is transmitted before byte 1. Within a byte, bit 0 is the least significant bit.
So they start counting at the least significant bit from the least significant byte? Then I could apply the filter using bitfield mask as you indicated.
But, along with this search, I find that for some reason HARP does not show me the CH4_column_number_density_validity variable. Not for CH4, not for any other gas (I looked it up in various datasets). The flag_vcd_flags field exists because I can see it by inspecting the files with VISAN, but when I import them with HARP they don’t show up. Even when I want to use it as a parameter to filter it tells me that there is no such variable. Maybe it’s something from the R interface? or a problem in HARP?
Sander! I found this answer you gave in another topic: If you perform a spatial binning, then the validity information will be removed. This is because you can’t perform an area weighted average of quality flags.
That was what was happening to me haha. Now I can access the CH4_column_number_density_validity variable! It only remains for me to understand the issue of bits to be able to use the bitfield mask correctly. Thank you so much.
Hello again! I kept looking and found in the Product Quality Readme File that the numbering of the bits follows the Big Endian convention. Following the numbering of the bits, and the filtering criteria, I understand that I am interested in the following bits:
15: convergence reached --> set TRUE (1)
14: solar zenith angle lower than limit (80°) --> set TRUE (1)
(…)
9: α CH4 between bounds --> set TRUE (1)
8: |error(α CH4)| < limit (0.01) --> set TRUE (1)
7: α CO2 between bounds --> set TRUE (1)
6: |error(α CO2) |< limit (0.005) --> set TRUE (1)
5: α H2O between bounds --> set TRUE (1)
Bits from 9 to 5 are an interpretation that I make with the little information available in the documents. Also in the filter criteria they indicate that the alpha errors must be greater than zero, it does not seem to be possible to make both distinctions with the quality flag. The other bits are not useful for my filtering.
So, considering all this and the Big Endian convention, I apply the bietfield operator like this: CH4_column_number_density_validity=&50144
Could you tell me if this makes sense or should I think about it differently?
Many Many thanks
I have been looking into this today as well. The bitmask filter that you mention is the one I arrived at as well.
However, I found that we had a bug in HARP. I already fixed it, but it is not yet available as an official HARP release. If you know how to install HARP from the latest main branch on github, you could already use it. Otherwise, you will have to wait a bit. We were planning to do a new HARP release soon anyway.
How wonderful! When you say “The bitmask filter you mention is the one I got to too”, are you referring to the expression CH4_column_number_density_validity=&50144? (I don’t speak English so sometimes I have a hard time interpreting haha)
Regarding the bug (it returned true if any of the bits were1 instead of all bits), I did not realize that this was happening. I examined a couple of registers on the ingested product and they all seemed to meet the conditions, but of course this could have been by chance. I don’t know how to install HARP from tha latest main branch on github but I’ll look for it! Thank you very much for everything.
I have one last question, in the Quality Readme File it says that clouds and aerosol products are provided at a different integration time than CH4, so that cloud fraction must be re-calculated for CH4 integration times. Is this something HARP already does when it ingests the field cl_frac from clouds_aerosol dataset along with the variables from CH4?
I was indeed referring to that expression indeed. And your English looks fine
It doesn’t look like we perform the averaging. I will investigate, there might be something we are doing wrong in HARP for this field (we will in any case have to improve the mapping description for this field (at the bottom of that page)).
Hi Sander, I was thinking and it just occurred to me to test the bitfield filters separately for each bit, within the harp::import operations (that is, first I filter with validity=&32768, then another, validity=&16384, and so on with the bits that interest me).
By doing this, the number of samples per bin for binning/averaging (the variable count in the imported product) becomes less than when using a single filter for all bits. Could this way get around the bug you have found perhaps?
Regarding the issue with the integration time of the cloud_fraction field, I am thinking of importing it separately and see if I can convert it to a raster for each day (only with the data of the cloud fraction). Then I could use this raster to filter the one from CH4. I have to think about it, because maybe the integration time will continue to interfere.
That is indeed a completely valid way of doing it. Good thinking!
This, also, sounds like a perfectly valid way of doing it. You have to make sure that you ingest the data using dataset=clouds_aerosol. Doing a spatial binning on the higher resolution cloud data would give you (within the accuracy that you are dealing with) the same result compared to first co-adding the cloud fraction to the CH4 grid and then calling bin_spatial.